
Decision Intelligence Blog: How to choose the right calculation method in Pyramid
How to choose the right calculation method in Pyramid

This Blog has been written by Debora Veh from our Partner Prodato
Applying calculations correctly in Pyramid Analytics.
The Pyramid Decision Intelligence platform combines Data Preparation, Business Analytics and Data Science in a single Data and Analytics environment. As a partner of Pyramid Analytics, we would like to present tips and tricks especially for new users to make the start with this platform as easy as possible.
Many will have already noticed that the seemingly same calculation can produce different results. But why is that, and which result is the correct one? What is the difference between Row-Level Calculation and Aggregations? And how are they implemented in Pyramid Analytics?
In this article, we will first explain the terms and then illustrate them with a use case example in Pyramid Analytics.
When do you use Row-Level Calculation?
Row-Level Calculation is a row-based calculation. All calculations are first performed at the row level and then aggregated afterwards, just like normal fields. Thus, the calculation is performed for each row in the data. Additionally, merging (row calculation) fields is more performant than splitting fields.
Use Case:
If you want to calculate sales, i.e., Price * Quantity, you calculate this at row level. Row level is important here to consider different prices for different products. In our example, the respective prices for different bicycles and bicycle accessories are multiplied by the number of sold items.
In Pyramid Analytics, a Row-Level Calculation is created either in the Model module via Calculated Columns or in the Formulate module. In Model, a new column is generated for the data and the result is calculated row by row. In Formulate, an aggregation block such as "Sum" is selected. Here the row level, for example an ID, is selected as a list and the desired calculation as data point.
When do you use Aggregations?
Aggregates are column-based calculations. The values are first aggregated, and then the calculation is performed on the aggregated result. It should be noted that aggregations can be very time consuming when dealing with large amounts of data. Aggregates must not be created in Model but should be created in Formulate or in Discover. Some values cannot be summed up, e.g., profit margin, otherwise they lose their meaningfulness.
Use Case:
Sums are used to calculate the share of profit in sales, i.e., profitability. Sums are also used to calculate profitability, Gross profit / Net sales * 100. Here, the total profit, of all products sold, is compared to the total net sales. This results in a percentage value; a subsequent summation would distorte the significance.
The choice of the respective calculation method is crucial for the informative value of the key figures independent of the platform.
Examples of calculations:
In the following, the implementation in Pyramid Analytics is explained using the presented use cases.
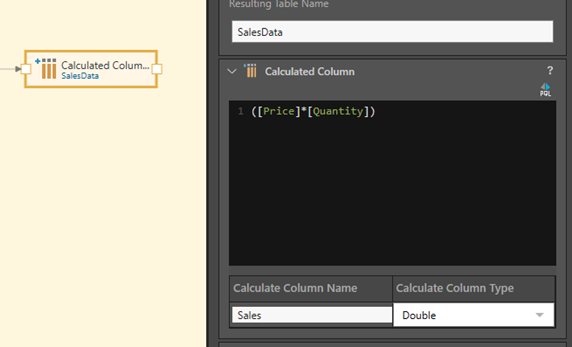
Row-Level Calculation in Model:
For a Row-Level Calculation, SUM ([Measure A] *[Measure B]) is calculated row by row in Model and then aggregated:
Row-Level in Formulate:
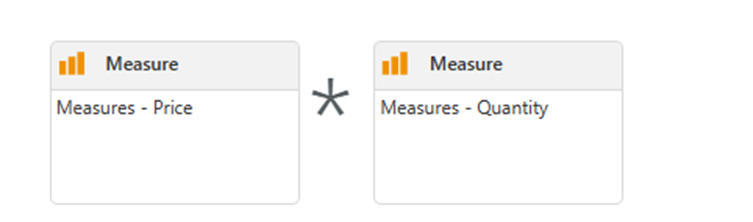
The same calculation looks slightly different in Formulate.
Two steps are necessary:
- Create the desired calculation and save it as "Formulate" in our case. Price*Quantity
- Step 2: Select "Sum" under Aggregation Blocks, then select a list, in our case TransactionsID, to include the row base.
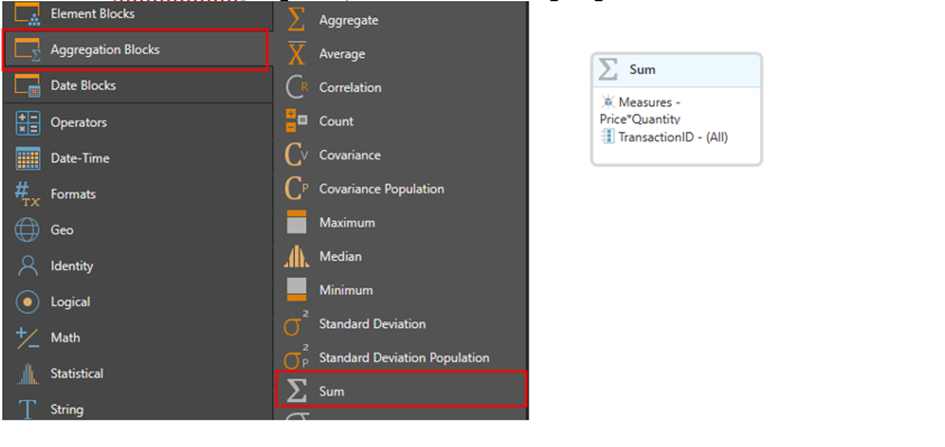
For the Data Point, the calculation created above can now be selected. Individually created measures can be found under the folder symbol "FX". It opens below "My Content". All formulas based on the selected model are displayed here.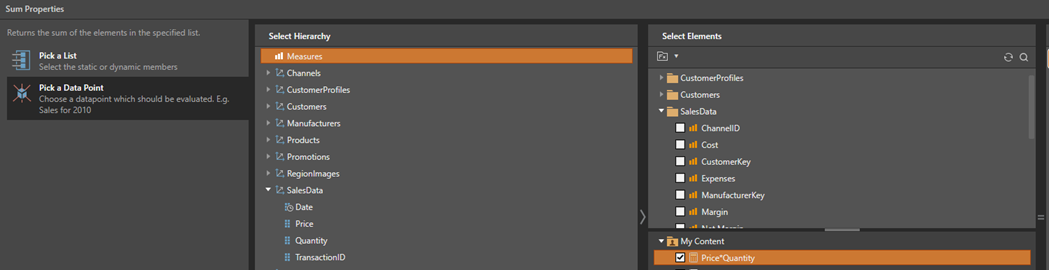
Aggregate:
With aggregates, the columns are first aggregated individually via Formulate and in the second step the calculation [{SUM([Measure A])} - {SUM([Measure B])}] / {SUM([Measure A])} is executed:
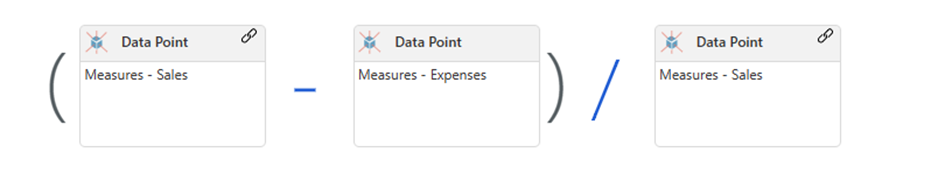
This formula calculates profitability: {(SUM (Sales)) -(SUM(Expenses))} / (SUM(Sales)). However, you can also calculate it directly in Discover:
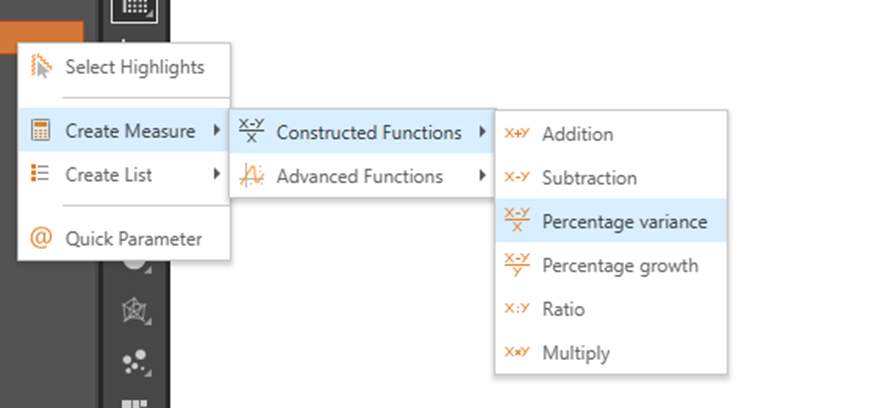
The formula above can also be easily replicated via Discover by selecting the two measures and calculating a new measure.
If you would aggregate sales instead of using row level, you would get useless results. Here, all prices would be added up and then multiplied by the number. The result is thus distorted since no distinction is made between inexpensive and more expensive goods. On the other hand, the calculation for profitability by using Row-Level Calculation could reach a total of over 100%, since the totals are not taken as a basis for 100%.
In the following figure, the green box shows the results calculated at Row-Level. The red box on the right side shows the aggregate example. Here, the dark blue "Grand Totals" row is the crucial one. The two Row-Level calculations include the sum of the lower rows, while the aggregation also adds up to a meaningful percentage, rather than adding up the percentages underneath.
As you can see, the Totals differ from each other, so you need to think carefully beforehand about which calculation type is the correct one for your use case.
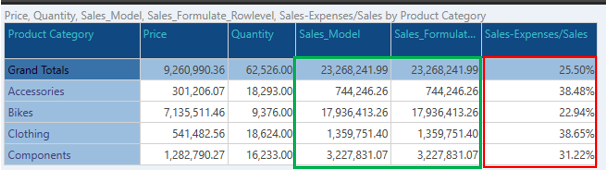
In Sales_Model and Sales_Formulate_Rowlevel (green box) the individual transactions are calculated:
(Price A* Quantity A + Price B *Quantity B + Price C * Quantity C ... ).
In Sales-Expenses/Sales (red box) all transactions are summarized:
[(Sales A+ Sales B+ Sales C) - (Expenses A + Expenses B + Expenses C)] /( Sales A+ Sales B+ Sales C).
For clarity, here is a snippet of the individual transactions:
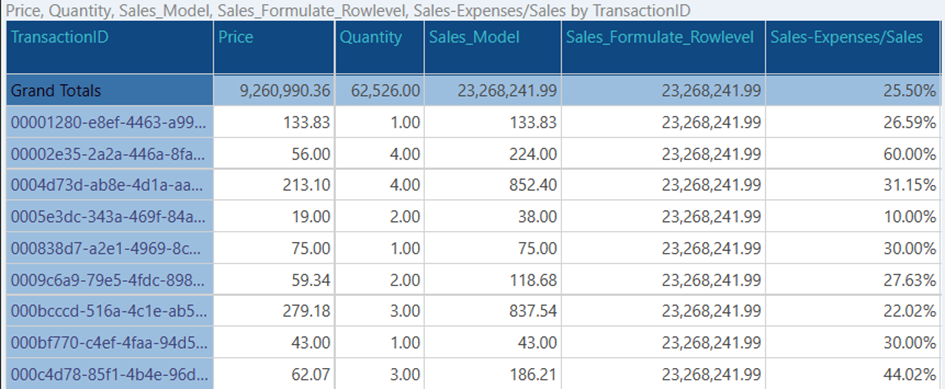
The "Grand Total" row is identical to the data in the previous screenshot, but this time the data has been displayed at a very small granularity, at the transaction level, so you can now clearly see the difference. While the "Sales_Model" columns reflect the respective calculation (Price* Quantity), the results for "Sales_Formulate_Rowlevel" are different to this. Only the totals for each row are shown, because the TransactionID was used to calculate the formula. The percentage calculation in the right column "Sales-Expenses/Sales" now shows the profitability for each row, please notice that the total value still does not exceed 100%.
Attention: On transaction level different numbers are calculated, only the totals do not differ for Row-level Calculation in Pyramid Analytics! If the same dimension, which was used for calculation in Formulate, is used in the grid, Sales_Formulate_Rowlevel will not show the desired level, but the total sum. This behavior may be desired for certain applications, but you should be aware of this behavior in advance. Aggregate behaves as expected regardless of granularity.
Because of the behavior shown above, it may be advisable to do your row-level calculations in Model.
Conclusion:
The choice of the particular calculation method makes a big difference in the results. This can be the difference between useful and useless results. Row-based calculations are implemented in Pyramid Analytics in "Model" via "Calculated Columns", or via Formulate via Aggregation Blocks. Aggregates, on the other hand, are calculated via the "Formulate" or "Discover" modules. The choice of calculations should be carefully considered to suit the intended use and to always get the right result.
Row-Level Calculation is used when the granular level is important for the calculation as in the calculation of sales. Aggregates are used to calculate for business metrics such as profitability or return on investment.
1 reply
-
Hi Debora,
Thanks for your contribution, it's great to see our customers and partners sharing and learning together!
Knowing which calculation type to use is very important in order to get the right result. To this end Pyramid 2023, released just 2 days ago, adds another level of calculation capability, the ability to create row level calculations, called Custom Columns, directly from Formulate and Discover, producing new, virtual columns in the underlying dimension table that appear as new hierarchies in the dimensions panel. You can even create new Model Measures this way.
As well as dynamically extending the Pyramid Semantic model from Formulate and Discover, these calculations can themselves be defined in the Model tables as dynamic virtual calculated columns as part of the Semantic Model. This is especially useful in Direct Query Models, were row level calculations need to be defined.
For more information on these calculation types see our newly updated and revised 2023 Help:
Hope that helps!
Cheers,
Ian
Content aside
- 5 Likes
- 3 yrs agoLast active
- 1Replies
- 668Views
- 1 Following