
-
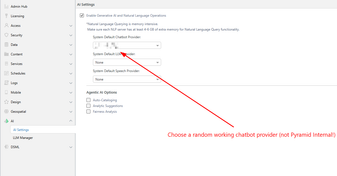
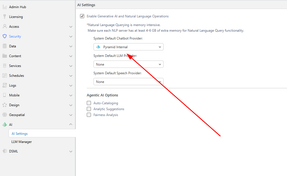
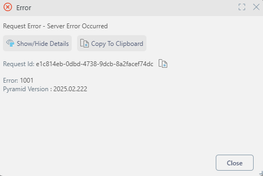
Error switching to Pyramid Internal LLM requires logout
Hi all! I’d like to report a bug regarding the LLM provider switching process. We have identified an issue where switching the default AI Engine from an external provider to "Pyramid Internal" causes…
-
Recurring pyramidPrinter startup failure on Ubuntu 20 after application updates
Hi! We are experiencing a recurring issue that is consistently reproducible in versions 2024.X and 2025.X in our environment running Ubuntu 20. Steps to reproduce:…
-
Edit an In-Memory Model's Target Table?
With an In-Memory Model target table, is it possible to edit the table's records? For an example, we have a user who takes daily snapshots of data. One of their historical dates has duplicates and…
- Answered
-
System table server_log_requests is not being populated after upgrade to version 2025.10.005.
Hi everyone! After upgrading to version 2025.10.005, the server_log_requests system table no longer records any entries. I checked the administrator console but couldn't find any relevant setting to…
- Answered
-
Why are Date fields exported as text in Excel but recognized as dates in CSV?
Hello Pyramid team, I have a question about Date/DateTime export behavior in Pyramid. After additional testing, I found the following behavior: If a Date/DateTime field has a model-level format…
-
Showing Forecasting Confidence Intervals in Crosstab
Hi everyone, I'm using the forecast feature in Discover. It shows a line chart, and for the forecasted periods it displays confidence intervals. Is there a way to show those confidence interval…
- Answered
-
Discover: Latitude and Longitude With Layered Maps
Hello, I am currently trying to create some layered maps in Discover that overlay store location bubbles on top of an area map. Unfortunately, it seems like layered maps do not support using latitude…
- Answered
-
Can we order the elements in the dimension tables how we would like and not in alphabetical order? In a discover have it grouped?
Can the elements in the dimension tables how we like and not in alphabetical order? When you open the discover it's always in alphabetical order the elements.…
- Answered
-
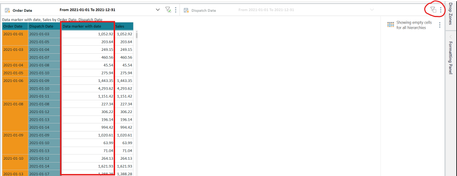
Sorting a measure using N-of-N
How do I sort the 2025 sales highest sales to lowest sales while keeping the subcategories unchanged. i want to sort them winin each subcategory.
- Answered
-
Execute JavaScript – Navigate to Specific Slide in Present
Hi Team, I'm trying to navigate to a specific slide in a Present Pro dashboard using Execute JavaScript action (not Jump To Slide). I wanted to share everything I've tried so far in case anyone has a…
-
Ai Driven Value creation - showing complete Json Value instead of the specific count
I am new to Pyramid. I was doing Use Case7. While doing 'AI Driven Value Creation" to add " Show population for each country". It's showing the entire JSON value.…
-
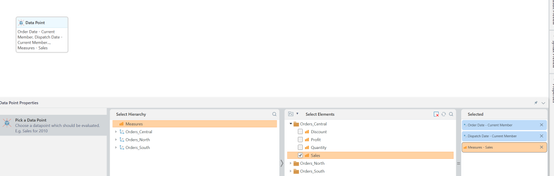
Dynamic “initial price” driven by a user-selected date filter
How do I calculate a dynamic “initial price” driven by a user-selected date filter? Background I have a receiving ledger with a few million rows of receiving entries.…
-
Is there a PQL equivalent to the MDX Generate function?
I have a report that I am trying to build that will display a current year period and a prior year period. The user needs to be able to select a date range.…
- Answered
-
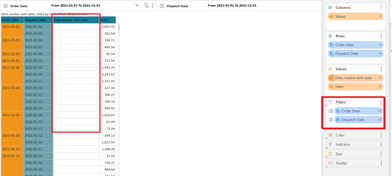
Error in interaction between two calendar filters
Hi all, i have the following problem - error in interaction between two calendar filters. How to reproduce the problem: 1) Create a calculated measure. 2) Create a visualization with two date filters.…
-
[Bug] Unpivot Settings causes a gray screen in Model
Hi Pyramid Team, I can reproduce a UI crash in Model when opening the settings window for an Unpivot node. Scenario: ClickHouse > Table > Unpivot Steps to reproduce: Create a new model.…
-
Unique features of Pyramid Analytics?
Hello All, I am new to Pyramid Analytics. I wanted to explore it. How Pyramid Analytics is different from other tools/technologies available in the market? like Power BI or Tableau or Oracle BI?…
-
Using the API to return the PQL or MDX of a Formulate
I have a need to retrieve a list of formulas from our instance that includes the name, description and the actual logic for documentation purposes. I have figured out how to get the first two items…
-
Issues with $0 values exported as $ in Excel export of a Publication
Hi, I have measures in my publication that display values as $0. When I export the publication to Excel, the values appear as just $ without the 0. I have attached screenshots of both the publication…
- Answered
-
How can I proactively identify content that overloads runtime servers?
Hi Pyramid Team, I am looking for recommendations on how to proactively identify Pyramid content that may overload runtime servers. I had a case where opening a specific content item caused very high…
-
How to configure Dashboard slicers to work with Tabulate slicers?
I have a tabulate that contains 2 discovers, both filtered by a date. I grab one of the rows from the second discover and place it at the bottom of the first sheet and create some calcs.…
-
Preserving Matrix Layout in CSV Export from Pyramid Discovers
Hi, We are currently using a matrix-format report with subtotals in Pyramid Analytics. However, when exporting the report to CSV, the columns become jumbled/misaligned because the matrix layout is…
- Answered
-
PQL Formulates
Hello PA Team, We have written the following formula to count the number of active users: Code-Snippet Count( Filter( allMembers([Nutzer].[Benutzer ID]), ([Nutzer].[Benutzerstatus].[1], [measures].…
- Answered
-
Unable to Validate Data Flow Because of the SQL Script Node
Hello PA Team, I encountered an issue with SQL Script node in the Master Flow. Steps to reproduce: Create new model and dataflow In our case it’s a simple dataflow from excel file to an In-Memory…
- Answered
-
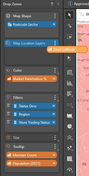
Sorting a Matrix in Presentation Breaks Hierarches
Hello PA Team, I found an issue with sorting hierarchies in presentation as a viewer. This problem exists in Version 2024.03.002. To reproduce this issue,…
- Answered
-
Object Renaming Does Not Work in the Search Panel
Hello PA Team, I found an issue with renaming objects in the Search panel. Steps to reproduce: Select any object in the Explorer, open its Metadata panel and copy its Item ID Reload the browser page…
- Answered
Got stuck with a report? Start a discussion or help others to move forward.