
How to apply Cumulative Function (Percent of Total) of rows/columns in Charts.
The "Percent of Total" calculation is a context calculation that is designed to factor the "shape" of the query in determining the scope of the calculation.
It's used to show the ratio between the current member value and the total member's value.
It's created by right-clicking the measure > Create Measure > Cumulative function > Percent of Total
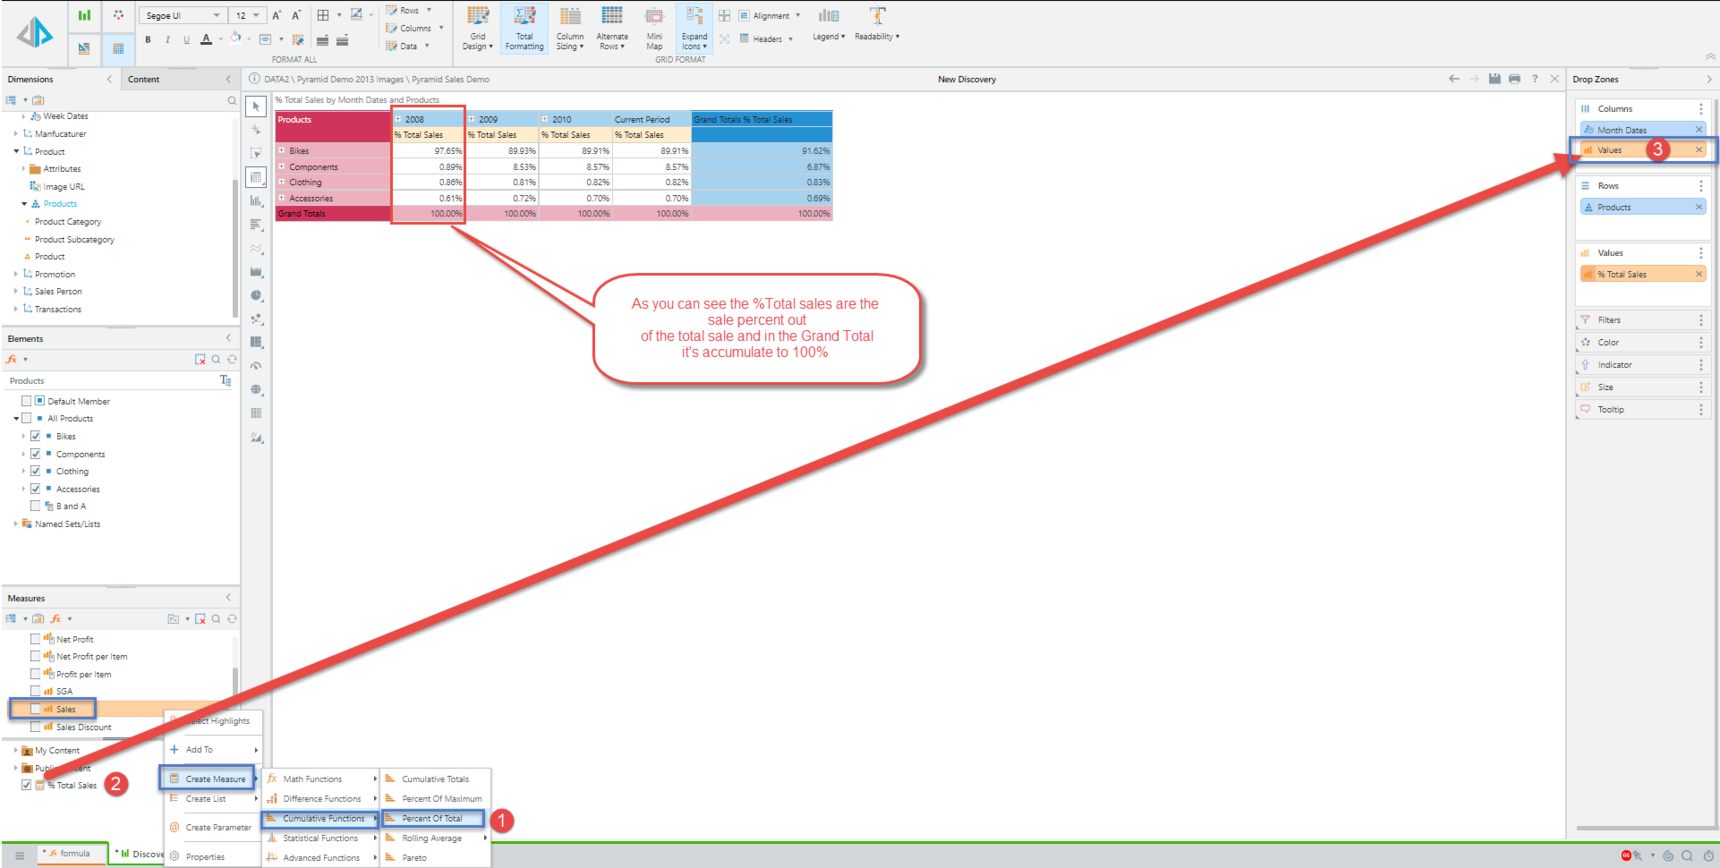
If the calculation is put on the rows, then it will calculate the "Percent of Total" by row.
If it's on the columns, it will calculate the "Percent of Total" by column (in the above image example).
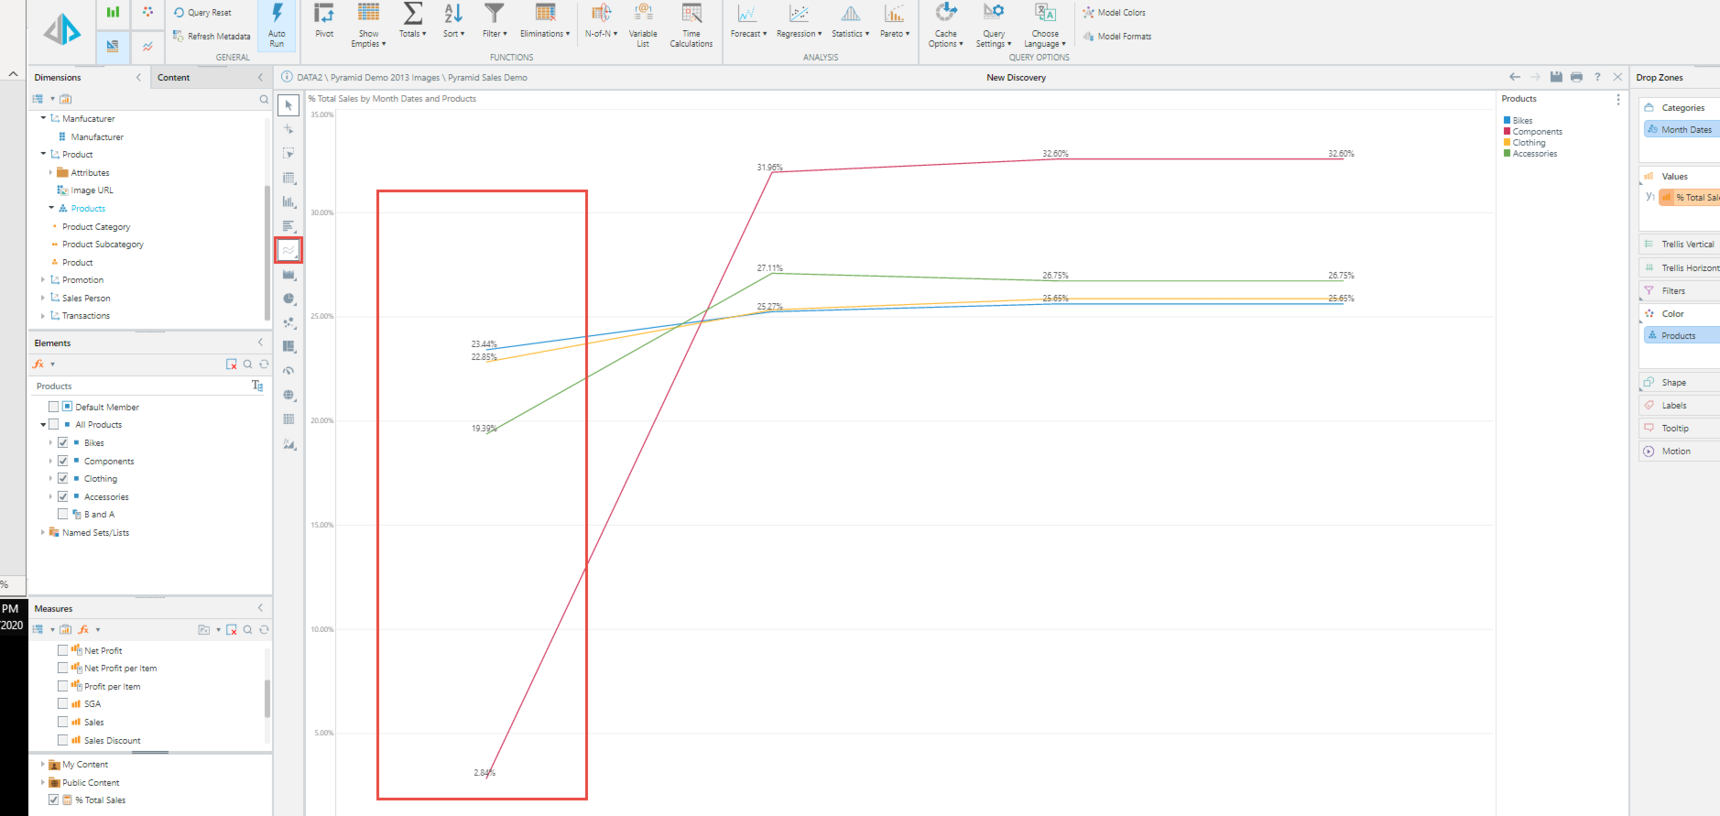
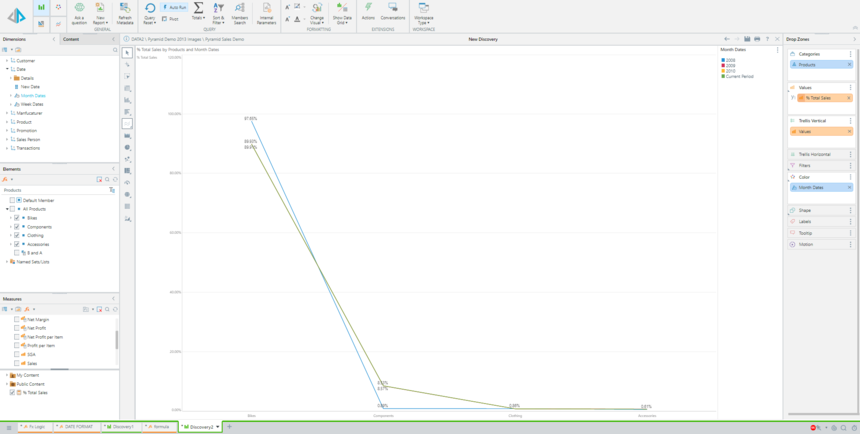
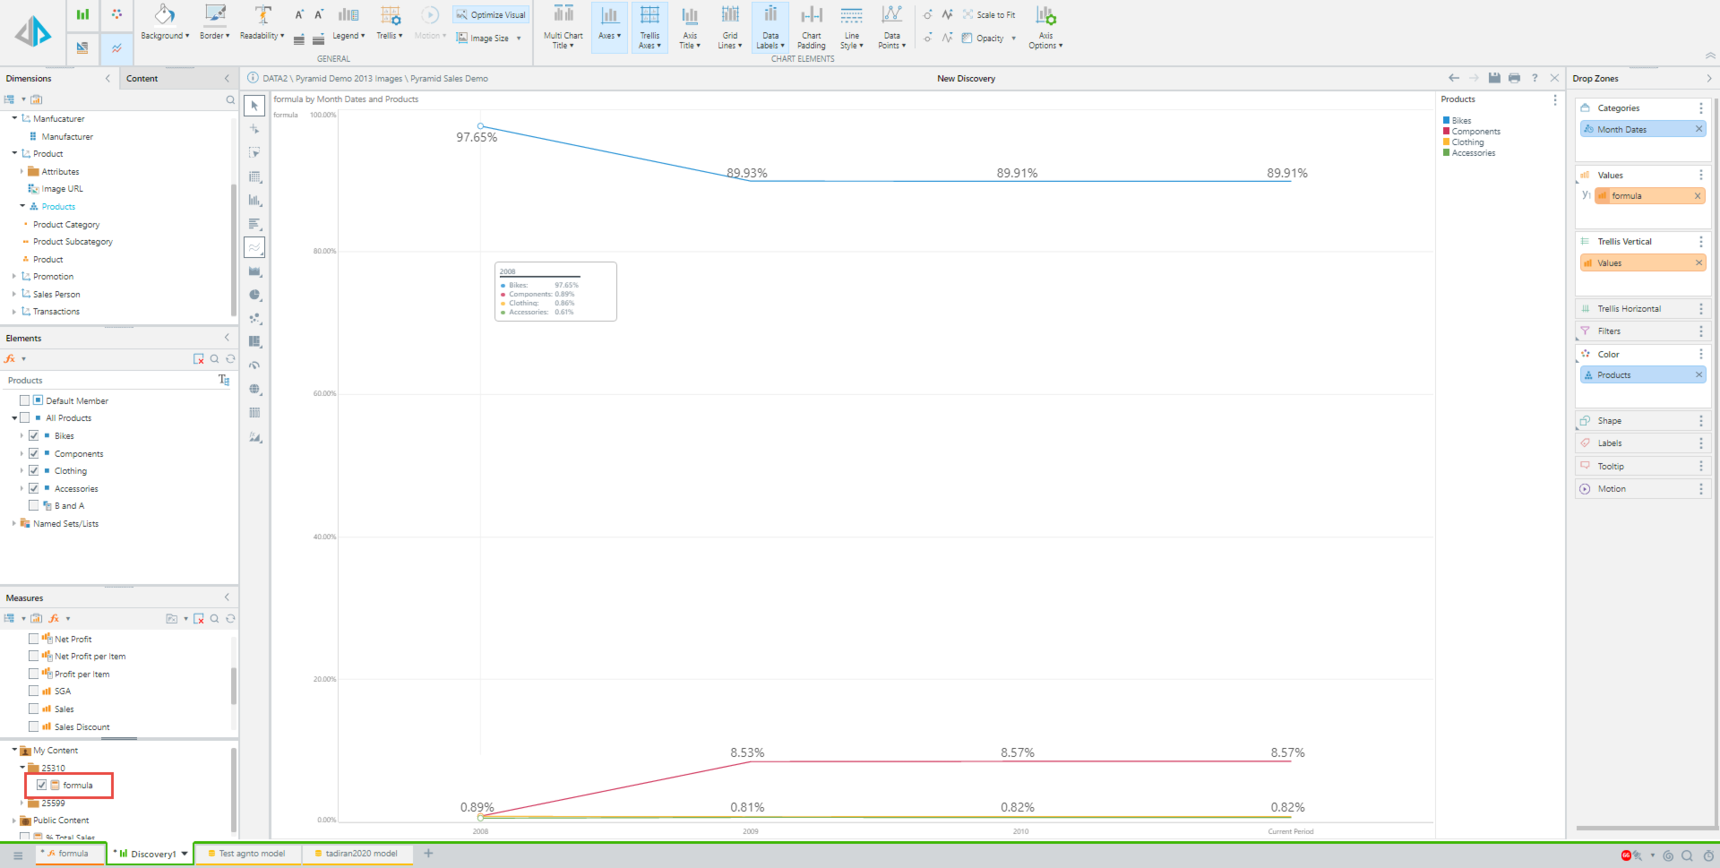
In a chart, it is calculating the percent of total BY SERIES (if there is a trellis, it will be by a trellis, by series as default and not by columns like the in the Grid).
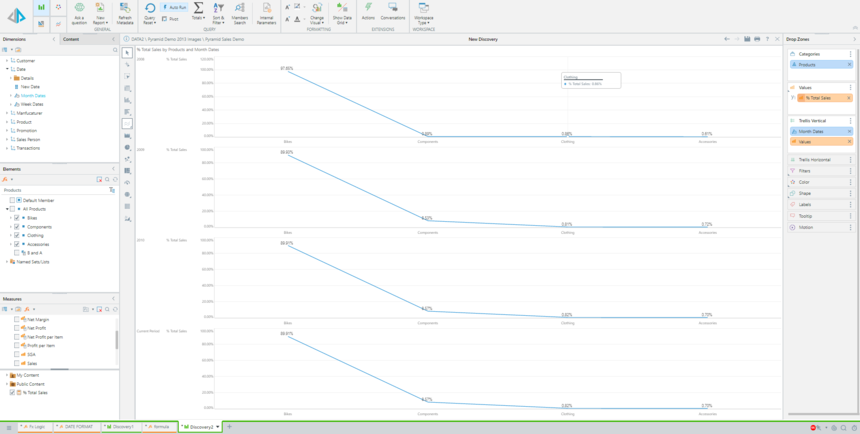
Using the Pivot button in a chart visual to replace the rows and columns attributes, The Percent of total function will accumulate per trellis per series,
In this example, it accumulates the sales of each Product category (under categories drop zone) to its related Year (can be set on Trellis or color drop zone) and will show the data as it shows in the grid "Visual".
 or
or
If the above methods do not provide the required results, it's also possible to create the “Percent of Total” as a custom member, so it will look like
"[Measures].[Sales]/([Measures].[Sales],[Product].[Products].[All Products])" or
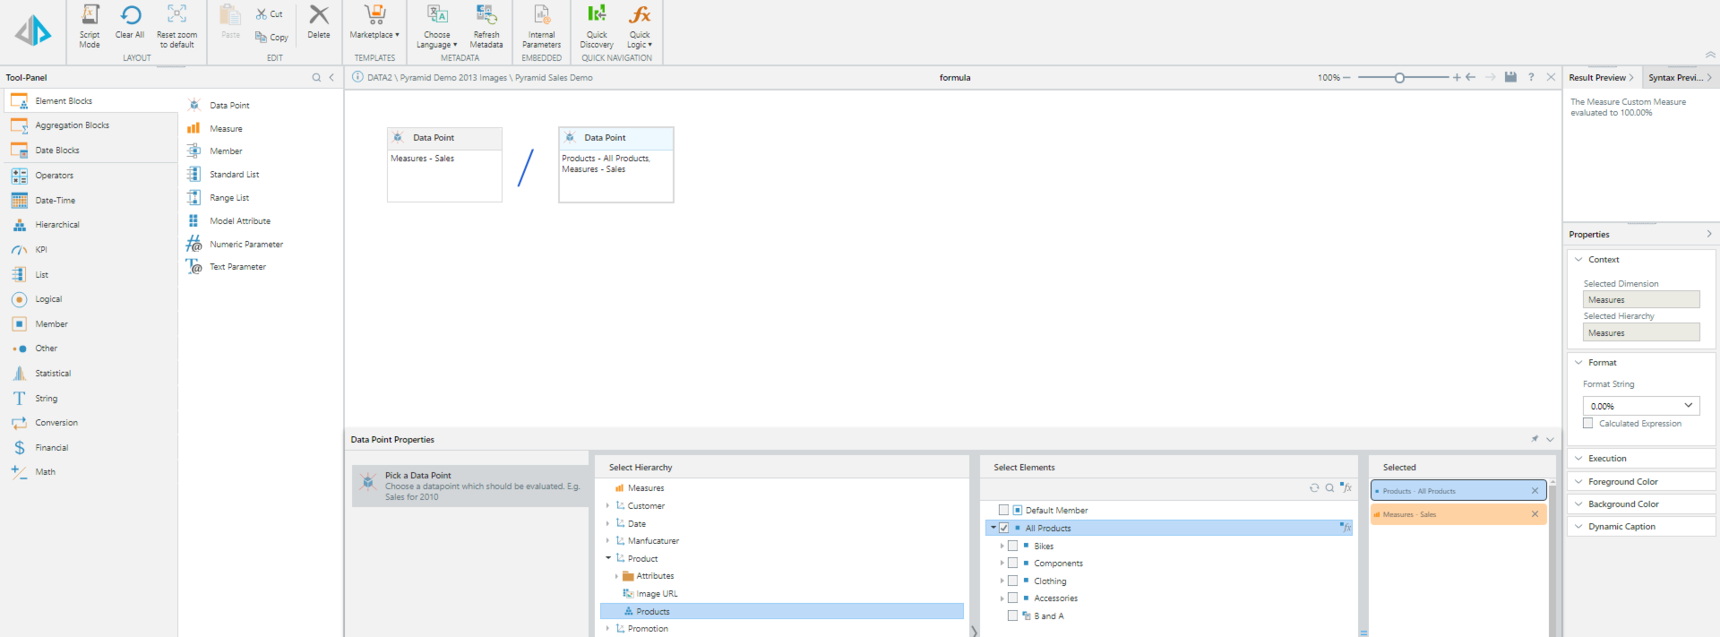
The results will be similar to the ones from the grid (first image):
Reply
Content aside
- 1 Likes
- 5 yrs agoLast active
- 554Views
- 1 Following