
-
Pyramid 2020.20 Issues Addressed
The following list enumerates all the main bug fixes in the 2020.20 version. Back to Pyramid 2020.20 release announcement Model Fixed an issue where unexpected results were returned in Discovery…
-
Tooltip "Default Value" vs Tooltip Drop Zones
I have two measures. I use measure one (Paid) in the Discover and Present (rounded to 1,000). I have original measure two (Paid Original) that I am dropping to Tooltip Drop Zone.…
-
Pyramid Email Subscription Delivers Both Excel and XML Files to Box
Hi Team, In a Pyramid model, we have an email subscription node configured to send an Excel file to a Box folder using the “Allow uploads to this folder” feature.…
-
Create a column chart with 2 measures
Its possible to create a column chart to show by day two measures? Current Value and PY value? Im facing issues because it split the chart in 2!
- Answered
-
Incorrect SQL generation in Calendar Slicer (Formula Picker) when using Last with Date granularity
Hello PA Team, I’m seeing incorrect SQL generation in the Calendar Slicer when applying function "Last" with Date granularity. The filter produces single-day matches per period instead of a full…
- Answered
-
Average and Median for the Dimension Value in a Frequency Table
1. Given the following frequency table: How to calculate the Average and the Median of the Value? Is this possible at all? In Excel at least the average could be calculated via SUMPRODUCT(Value,…
- Answered
-
Recurring pyramidPrinter startup failure on Ubuntu 20 after application updates
Hi! We are experiencing a recurring issue that is consistently reproducible in versions 2024.X and 2025.X in our environment running Ubuntu 20. Steps to reproduce:…
- Answered
-
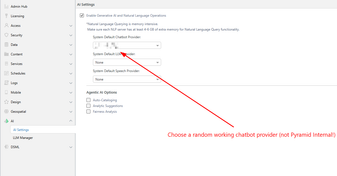
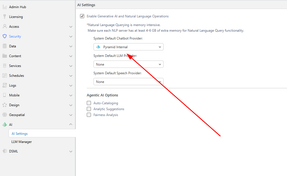
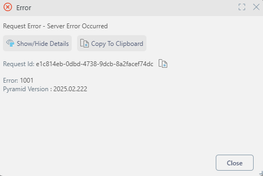
Error switching to Pyramid Internal LLM requires logout
Hi all! I’d like to report a bug regarding the LLM provider switching process. We have identified an issue where switching the default AI Engine from an external provider to "Pyramid Internal" causes…
- Answered
-
Enabling Multiple Selections for a Presentation Column
Hi Team, Is it possible to enable multiple selections for a column in a presentation? Thanks, Raveena
- Answered
-
Creating Reports in Pyramid - Quick User Guide
I am pleased to share with you what I think will be a useful guide for anyone new to creating reports in Pyramid. Experienced users might also find it useful
 This guide is intended to serve you as…
 -
System table server_log_requests is not being populated after upgrade to version 2025.10.005.
Hi everyone! After upgrading to version 2025.10.005, the server_log_requests system table no longer records any entries. I checked the administrator console but couldn't find any relevant setting to…
- Answered
-
Edit an In-Memory Model's Target Table?
With an In-Memory Model target table, is it possible to edit the table's records? For an example, we have a user who takes daily snapshots of data. One of their historical dates has duplicates and…
- Answered
-
Showing Forecasting Confidence Intervals in Crosstab
Hi everyone, I'm using the forecast feature in Discover. It shows a line chart, and for the forecasted periods it displays confidence intervals. Is there a way to show those confidence interval…
- Answered
-
Measure Formatting in Pyramid: Special Formatting Techniques
When creating measures in Pyramid, you can customize how numbers display using the measure format. Measure Formats can be managed in the Data Model: These can be overridden by role in Model Settings…
-
Can we order the elements in the dimension tables how we would like and not in alphabetical order? In a discover have it grouped?
Can the elements in the dimension tables how we like and not in alphabetical order? When you open the discover it's always in alphabetical order the elements.…
- Answered
-
Why are Date fields exported as text in Excel but recognized as dates in CSV?
Hello Pyramid team, I have a question about Date/DateTime export behavior in Pyramid. After additional testing, I found the following behavior: If a Date/DateTime field has a model-level format…
-
Advanced Messaging options in Pyramid Analytics
he Master Flow allows you to send emails and SMS messages, As we've seen before with sending emails upon failures. You would probably want to send emails that are informative,…
-
Send a Message on Model Failure
This short guide will show you how to use Messaging Components in Pyramid Analytics Model Definitions Master Flow, to send messages upon execution failures.…
-
Discover: Latitude and Longitude With Layered Maps
Hello, I am currently trying to create some layered maps in Discover that overlay store location bubbles on top of an area map. Unfortunately, it seems like layered maps do not support using latitude…
- Answered
-
Sorting a measure using N-of-N
How do I sort the 2025 sales highest sales to lowest sales while keeping the subcategories unchanged. i want to sort them winin each subcategory.
- Answered
-
Direct Query vs Ingestion: When to Use Each
Choosing the right data connection approach for your Pyramid model What's the Difference? Direct Query queries data at its source in real time. Every report interaction sends a query to the source…
-
"Model", one word and many meanings
When working with Pyramid Analytics we often mean different things when we refer to “Model” or “Data Model”. In this post I will clarify the main distinctions between the different model terms.…
-
Display dates in viewer's timezone
I'm looking for a way to display date/time fields in Discoveries (and elsewhere) in the viewer's time zone. We store datetime values in the source data in UTC and when we show it in reports we want…
- Answered
-
Execute JavaScript – Navigate to Specific Slide in Present
Hi Team, I'm trying to navigate to a specific slide in a Present Pro dashboard using Execute JavaScript action (not Jump To Slide). I wanted to share everything I've tried so far in case anyone has a…
-
Troubleshooting intermittent "Grey Screen" crashes in Content Explorer
Hello Community! I am running Pyramid version 2024.03.002. I am facing a recurring but inconsistent stability issue where the UI completely crashes to a "Grey Screen" while I am working.…
Welcome to the Pyramid User Community
Pyramid User Community