
Time intelligence: Date-time calculations made simple

This is the third blog in the series on how Pyramid brings time intelligence into analytics.
As covered in my previous blogs on time-intelligence, adding date-time groupings into your data makes the most basic analysis and reporting of data functional. Depending on your business, seeing sales by month is generally far more functional than seeing it by day. Understanding quarterly profit is easier to digest than seeing it week by week.
Grouping data into logical time periods is helpful but does not always provide the full story. Business users are looking to understand the changes in values over time, not just static data snapshots, which usually requires clever calculations.
Date-time calculations
It’s common for a user to want to compare calculated date values over a range of dates against similar date ranges For example, a user may want to compare the difference in quarter-over-quarter sales,. Another user may want to compare year-to-date expenses with previous year-to-date expenses. The creation of these dynamic date-time calculations plays a critical role in the analytics platform. And once they have been made, they should be reusable in many dashboards and reports.
Pyramid’s analytic tools and query language functions allow date-time calculations to be easily built, covering an almost limitless set of calculation varieties. These capabilities include a freeform function editor to build any type of required logical expression for advanced users and one-click wizards and menus for non-technical users—to auto-generate the different types of logic without code or complexity.
The power of this approach allows these calculations to work in almost any query configuration—across any other dimensions and applicable to any and all metrics. And like all shared business logic elements in Pyramid, once these calculations have been set, they can be reused in multiple dashboards and reports.
Business case
John, the CIO of Intensive Health Care, would like to analyze his sales, net profit, expenses, overhead costs, and quantity. His analysis of several time views periods for the above metrics in a single dashboard will give him a bird’s-eye view of all key metrics for year-to-date, quarter-to-date, month to date, and week-to-date amounts.
The challenge
Using Power BI, John is required to separately write code for each metric, multiplied by the number of time-period calculations required. Using our example, this will mean 20 different sets of code (five metrics times four calculations). Yikes! Worse, they are hard coded to the current date only. Clearly not a BI analyst’s dream solution.
DAX example of coding for a single MTD calculation on sales
so MTD :=
IF (
    HASONEVALUE ( Dates[ISO Year] )
        && HASONEVALUE (Dates[ISO Month Number] ),
    CALCULATE (
        SUM ( Sales[Sales Amount] ),
        FILTER (
            ALL ( Dates ),
            Dates[ISO Year] = VALUES ( Dates[ISO Year] )
                && Dates[ISO Month Number] = VALUES ( Dates[ISO Month Number] )
                && Dates[Date] <= MAX ( Dates[Date] )
        )
    ),
    BLANK ()
)
Pyramid’s tidy, codeless solution
Pyramid, on the other hand, offers a quick, codeless solution to add all above time intelligence variables in a single click using the “Time Intelligence” wizard in the Discover app—shown below.

Once the calculations have been created and added to his report, John can continue adding as many metrics independently without requiring any further coding. In fact, he can select all the date-time calculations in one step, allowing him to view and analyze them in a single visualization.
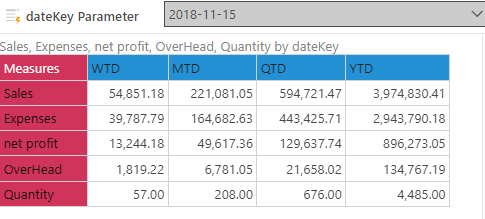
If he elected to parameterize his logic, he can also choose the date that will drive the date-time input selections for determining the WTD, MTD, QTD, and YTD date ranges—making both the use of the calculations and their logic highly flexible at the same time.
See how all the calculated values for WTD, MTD, QTD and YTD change if we change the date in the parameter below:

This ability to create multiple metrics for various time periods in a few seconds instead of a few hours is a solid example of the power and flexibility of Pyramid’s calculation engine. To further boost the capabilities, advanced users can build fully customized date-time calculations using the underlying functional and querying logic. I’ll cover this in my next blog.
This post originally appeared at https://www.pyramidanalytics.com/blog/details/blog-time-intelligence-date-time-calculations-made-simple
Other Resources
Time intelligence: A critical element in all analytic projects - Blog
Time intelligence: Date-time groupings for better visibility - Blog
Time intelligence: Custom calculations for greater perspective - Blog
Time Intelligence: How date lists and ranges accelerate insights - Blog
Using the Time Calculation Wizard Video
Reply
Content aside
- 5 yrs agoLast active
- 328Views
- 1 Following