
Like for Like reporting
Hi,
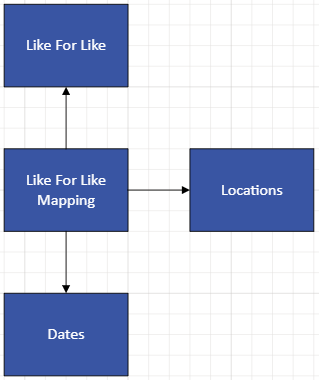
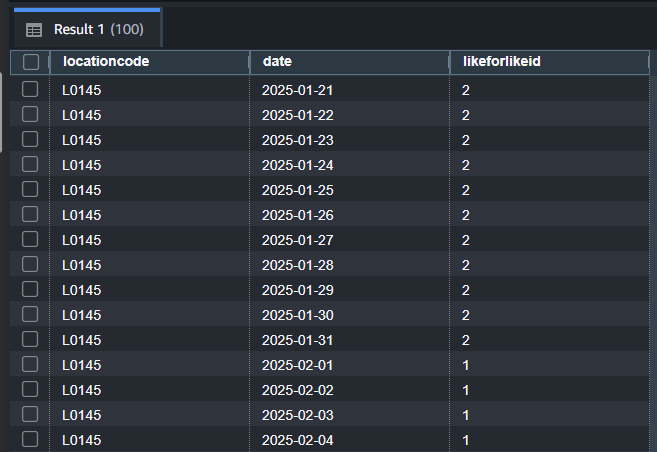
I'm trying to do some like for like reporting - i.e. if one of our locations wasn't open more 365 days ago, we need to exclude the location from our report. I have a locations dimension, a date dimension, and a like for like dimension. Sitting between them is a mapping table of locations, dates and a like for like ID
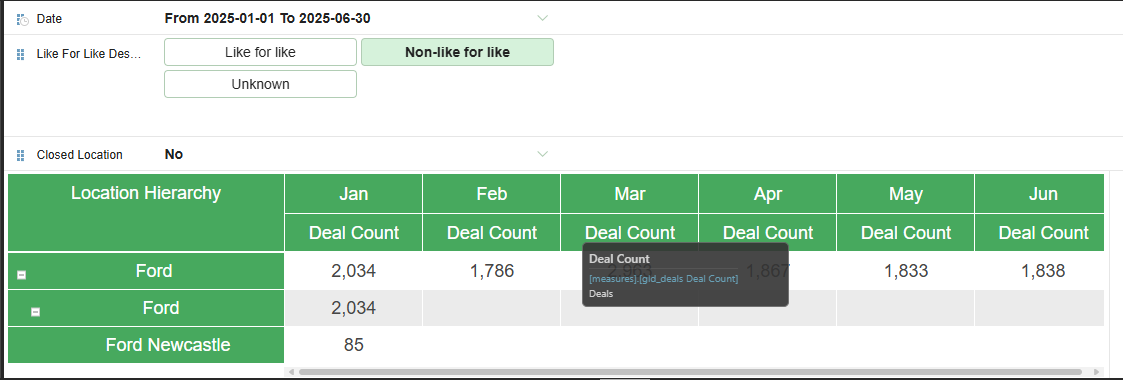
I've created a report using this structure, and at location level it works as expected. As an example, Ford Newcastle became a like for like location in February 2025, so was blank in January.
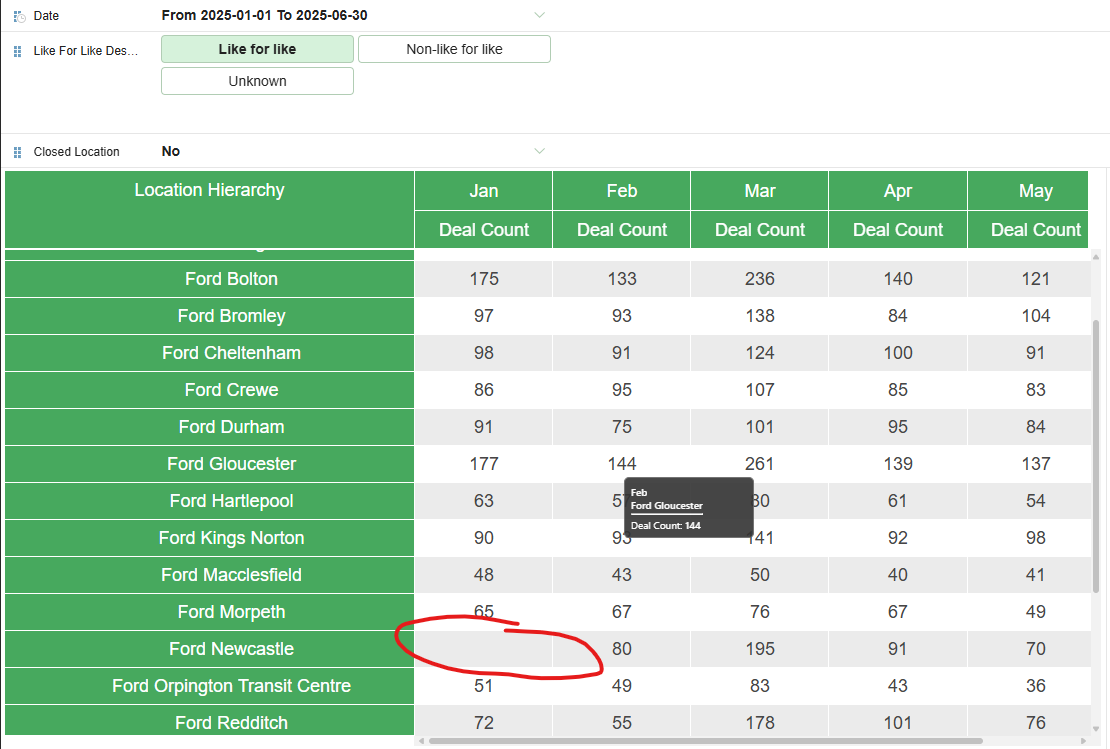
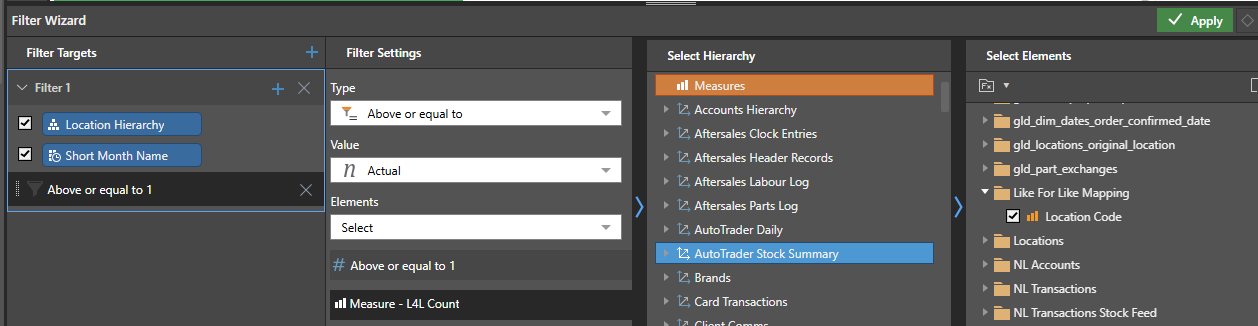
And I'm achieving this by having a filter where the count of like for like locations in the mapping table is greater than 1
However this does not persist across different levels of the hierarchy. I'd expect to work from the base level of location upwards and aggregate the franchise and division accordingly but we're just seeing the totals being calculated, irrespective of the like for like / non-like for like flag
Has anybody done any like for like reporting and how have you achieved it? Any help would be greatly appreciated
Cheers
Rob
2 replies
-
Hi
I've tried to recreate your model, using the data in the mapping table you provide and adding Dates table for the dates you show, a location table with L0145 code for Ford Newcastle which sites in a a hierarchy of Division --> Franchise --> Location of Ford --> Ford --> Ford Newcastle. But I think I'm missing some information.
What Measure are you showing in your example above and in which table does it sit?
The Like for Like table... what is in there? what is the relationship between the mapping table and the like for like table? 1 to many or many to many?
How is the L4L Count defined? what is it counting? and where from?
Maybe if you could provide some additional dummy data for the Location and Like for Like tables it may help (attach Excel files please)
If the filter works at the bottom of the hierarchy, great. But I wouldn't expect it to work at higher levels because it's aggregating from other locations as well. Are you expecting that because there is nothing for Ford Newcastle, the hierarchy levels above will show nothing as well? Ignoring other locations? That doesn't seem logical to me.
Can you perhaps elaborate a bit more on what you are expecting in your query vs what you get?
Thanks,
Ian
-
Hi Ian,
Please see attached spreadsheet for relevant tables.
Like for like mapping joins out to locations and dates. The like for like ID is determined based on the recognise after date in the locations table in the Data Warehouse, and you'll notice Newcastle has a recognise after date of the 31st Jan 2025.
The measure being used in the report is the deal count, which is doing a count of DealIDs from out deal table.
The measure being used in the filter was doing a distinct count on location based on the mapping table, but as you pointed out, that won't work at a higher level if we're just using the count as a true / false mechanism
The relationship between the like for like table and the mapping table is 1:many, based on the likeforlikeID
What I'm expecting is for it to aggregate the base level up through the layers - effectively a filter on the location dimension for a point in time if that makes sense? So for non-like for like locations, Newcastle is the only location to appear in the mapping table with likeforlikeid = 2. I would expect that to filter to apply to every level of the hierarchy as no other sites should even enter the calculation, so how it's giving a full aggregate of the franchise and division is a bit baffling. I realise this isn't the way to go anyway, now you've pointed out the filtering problem, but in this specific instance where there's only one site, I'd have expected it to work. Similarly, if I chose like for like locations, I'd want Newcastle to be filtered out from January, but then included from February onwards, and the aggregates for franchise and division levels being a reflection of that too. Hope that makes sense
I used to achieve this in SSAS cubes by method of scope statements. Is there anything similar we could use within the Pyramid model to the same effect?
Cheers
Rob