
-
Discover: Latitude and Longitude With Layered Maps
Hello, I am currently trying to create some layered maps in Discover that overlay store location bubbles on top of an area map. Unfortunately, it seems like layered maps do not support using latitude…
- Answered
-
Dynamic “initial price” driven by a user-selected date filter
How do I calculate a dynamic “initial price” driven by a user-selected date filter? Background I have a receiving ledger with a few million rows of receiving entries.…
-
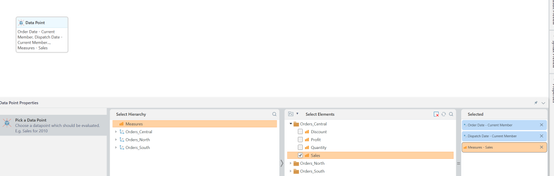
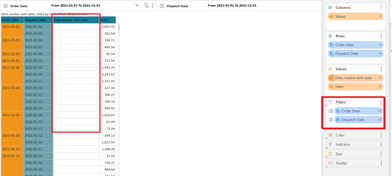
Error in interaction between two calendar filters
Hi all, i have the following problem - error in interaction between two calendar filters. How to reproduce the problem: 1) Create a calculated measure. 2) Create a visualization with two date filters.…
-
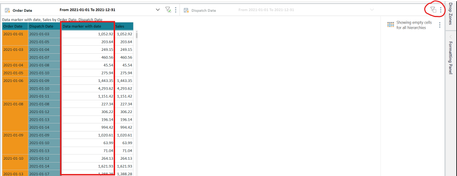
Need Help Creating Dynamic Previous Month Sales, Current Month Sales & Growth % in Pivot
Hi Team, I need help creating Previous Month Sales, Current Month Sales, and Growth % in a Pivot. I have: A Sales column A Sales Date column in yyyy-MM-dd format Initially,…
- Answered
-
Only primary Y-axis shall be colored...
Dear Community, I like to have a simple combined chart: "SALES by PRODUCT CATEGORY" as stacked column on the primary Y-axis "MARGIN" as line chart on the secondary Y-axis So, it should look like this.…
- Answered
-
CSV Export Changes Column Order in Pyramid Discover/Presentation
Hi Team, Greetings. When exporting a CSV file from Discover or Presentation, the column order changes to a weird (non-alphabetical) sequence. I want the columns to export in the exact same order as…
- Answered
-
I have calculated field as 'Average Time Spent.' Now I want to use that field as a filter in Discover or as a filter in other formulas.
I have calculated field as 'Average Time Spent.' Now I want to use that field as a filter in Discover or as a filter in other formulas. is this possible without writing anything in data model
- Answered
-
Filter a second dimension based on the value of a first dimension in Discover
Contents Hi Community, Please bare with me whilst I try to explain what I am trying to achieve. This is a very slimmed down example, but suffice to say,…
- Answered
-
Help Getting Stacked Bar Plot to Use a Consistent Set of Colors
I am building a discovery that is a paired stacked bar plot with the following characteristics: The X-axis is year. The Y-axis is a percentage of total annual insurance cost of workplace injuries.…
- Answered
-
Let's talk about Dimensions and Measures
Dimensions and measures are the two central building blocks in multidimensional reporting. In Pyramid Analytics, they are mainly dealt with in the “Model” and “Discover” modules.…
-
How to get a Discovery Bar Graph to Sort by One Specific Group ?
I am attempting to build a bar graph displaying data segmented by two bars and I want to sort the bars by magnitude, but I want the bars to only sort by one specific category.…
- Answered
-
How to undo total column color formatting
I created a few discoveries and color formatted the total and Subtotal columns. I added color formatting to the rest of the table but was then told that this needed to be done in the Total columns as…
- Answered
-
Selecting Multiple Dimensions at Once
Hey all, This is a simple question about whether a certain functionality exists in Pyramid. Is a user able to select multiple dimensions and add them simultaneously?…
- Answered
-
Filtering on 2 dimensions and counts
Hi community, I am struggling to do something that I think should be possible so asking for help here
 I have a star schema modelled in snowflake and a Direct Query model in Pyramid consisting of a…
- Answered
-
In a Discovery, how to identify records that do not have a corresponding child record
Hello, Here is the scenario. We have insurance policies in a policy table which joins to a coverage table by a policy_id primary key which is a foreign key in the coverage table.…
- Answered
-
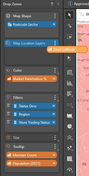
Is there a way to disable the drop zone pop ups in Discover?
I want to be able to turn off the drop zone pop ups. I'd like this specifically for the 'Analyze Further' use case, but I would be satisfied with disabling it entirely.…
- Answered
-
Is there a way to apply Dynamic Masking (or something similar) to Measures?
My team and I would like to create a grid discovery for external users. We would like the values from certain Measures to be encrypted to external users,…
- Answered
-
Is there a way to create a parameter for a user to choose the time display (eg month, quarter, year)?
Our users would like to be able to choose, on a presentation, to display all the discoveries by either week, month, quarter or year. Is there a way to have a drop down that would change each…
- Answered
-
Slicer to switch between months and weeks with same amount of bars in a barchart
Hello, we are currently building a dashboard that uses a global parameter as slicer to switch between months and weeks. The goal is to have some equal amount of bars in a barchart.…
- Answered
-
Table in Present automatically changing to different style on resize.
Morning all, Quick question, if I create a table in a discover then place within a Present, the table will automatically change type when the size is reduced to a certain level.…
- Answered
-
Seeking to Apply Security to End Users on 'Analyze Further' option for discovery
I am working on a discovery for a client-facing presentation that I want users to use the 'Analyze Further' feature to explore. Within the matrix grid discovery,…
-
Dot and Ref. Line Plot
I am trying to reproduce a dot and reference line plot in Pyramid. I know what I'd like to do and am having trouble implementing it in Pyramid. I've attached the image of the chart which was…
- Answered

-
Access Multiselect Parameters values in Formulate
Hi, I’m trying to access multiselect parameters in Pyramid Analytics. Specifically, when using multiselect parameters in a dynamic caption, only the first selected value is shown,…
- Answered
-
How to Limit Color Logic to a Single Column
In the screenshot, there is a color-coded "Med Surg Supply Cost / Equiv. Patient Day" measure, where the red-green split is based off the average of those values. How do I 1.…
- Answered

Got stuck with a report? Start a discussion or help others to move forward.