
How to Limit Color Logic to a Single Column
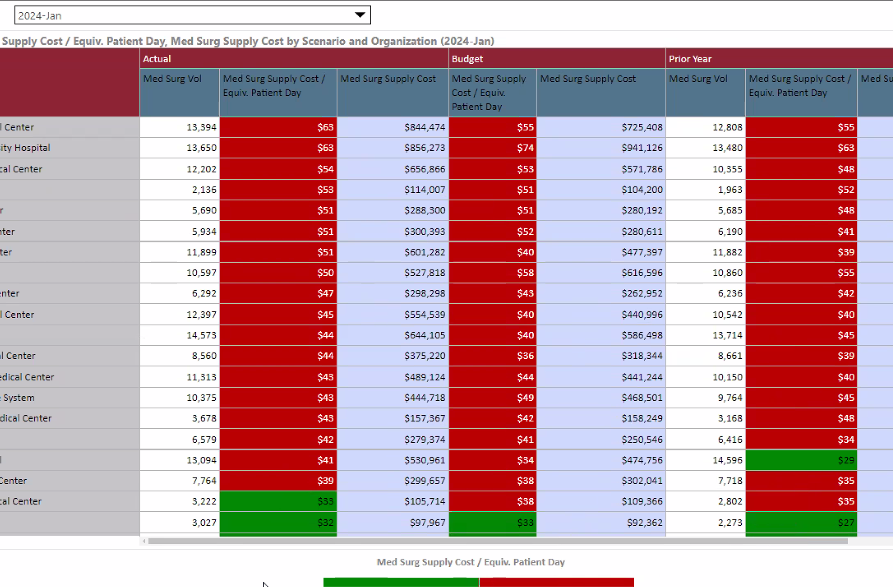
In the screenshot, there is a color-coded "Med Surg Supply Cost / Equiv. Patient Day" measure, where the red-green split is based off the average of those values. How do I
1. Make ONLY the column under "Actual" color coded and have the other two columns non-colored?
2. Have the average value be calculated from ONLY the column under "Actual", as opposed to all values across three columns?
The easy answer is to exclude Budget and Prior Year entirely, but I need all three to be on a single report.
Thanks so much for your help,
JAF
(Names intentionally cut off and data fabricated to protect proprietary information)
2 replies
-
This can be easily done through the context menus (rather than the drop zones) as shown below. Here, choose the driving data point, rather than the entire measure.

If you edit the special color chip calcs now sitting in the drop zones (right click on them), you get the advanced formatting dialog. Here you can build any logic you want to drive the coloring - including other calculations and measures (which you would build manually if you need some thing super specific). Also, the color selection logic (green box) can be edited - for even more granular control of the formatting mechanics.. Right click to open the formula editor.
