
-
How to connect Google Sheets to Pyramid
Pyramid can model and blend numerous complex data sources for basic or advanced analysis. The quick tutorial below shows how you can use Pyramid to access and import data stored in a Google Sheet,…
-
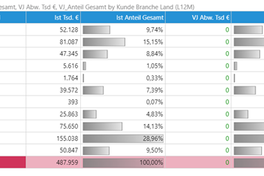
Totals of sets
Hi, It seems that we are not able to show totals whenever we make sets. In the attached example you will see it shows totals from the data that are directly coming from the dimension (black arrow)…
- Answered
-
Multiple PlaceHolders in a text box - work once then disappear
Hi I have text boxes on a Present, if I add a single Placeholder and use Interaction Manager to associate it with an item then everything is cool and it works.…
- Answered
-
Hiding an item from the legend?
Hi I have a couple of items in a Discovery which are there to support the chart structure but shouldn't be in the legend, can i prevent them from showing?…
- Answered
-
How to Update Pyramid 2018 to the latest version.
Hey team, Steps involved in up-gradation of Pyramid 2018 to Pyramid 2018.1.200. Thanks B Rama Krishna
- Answered
-
Example of how to authenticate and embed Pyramid content.
For Embed on Pyramid 2020.11 please see this link. Below is a simple example of a web page that displays Pyramid content and authenticates to the Pyramid Embed API in order to create a cookie for…
-
Calculating max/min difference in context
Hi there i want to reduce a range of time series lines into a single area spanning the max and min values in each time point. I've had a go with creating an Fx but i suspect i need a context…
- Answered
-
Database Write Back
Pyramid is often asked when they will add a "write back" option to the tools. Often such functionality is centered around capturing end-user data input or budgeting and planning applications.…
-
Line chart - multiple items, all one colour
Hi I've a bar chart which was multicoloured when new, i dragged the Geography item from Colour zone to Categories zone and the chart bars all became default blue which is just excellent.…
- Answered
-
Custom sort ordering - order by top N but leave "other" at bottom
Hi I have a table which shows the top N brokers, and then has the rest in an "other" bucket.. this works brilliant but I need to sort by the top N by premium but leave the "other" bucket at the…
- Answered
-
Geospatial map using german zip codes
Hi folks, I try to use the geospatial map visual on an AS cube and have understood that I need to somehow combine cities with their countries, because there might be cities with the same name in…
- Answered
-
Formulate: Comine Standard List with a Measure
Hi guys, I'm not sure if I'm just "standing on the tube" or if my idea can't be realized, so I hope for your support: In formulate, I want to combine the function of a "standard list" with a measure:…
- Answered
-
How can we identify which part of a theme to change?
Wondering if there is some kind of documentation that would help me identify which part of a theme to update to have the impact I'm wanting in a Discovery.…
- Answered
-
Cascading Slicer question
I have a report that had non-cascading slicers for Course College and Course Department. The report displays Course Section and Attempted Class Count. It made sense to have a cascading slicer for…
- Answered

-
Defining Custom Color Palette
Hi there, today I used the "more color" option to define a custom color to work within my publication. After generating these Custom Colors, they were availabe in all modules and options where its…
- Answered
-
Usage statistics
Hi team I would to ask if in PA 2018 you have embedded a user usage cube as in BI Office. If not is it in planning? Thx Nikos
- Answered
-
Grand Total: calculation
Hi together, I have built a simple table via Discover and created a quick calc: percentage growth between 2018 and 2015. If I now activate "Row Totals" via the Discover Ribbon,…
- Answered

-
Creating/displaying global slicers in present
We have started converting content from BI Office to Pyramid and I haven't been able to find clear instructions on how/if global slicers work in presentations.…
- Answered
-
Trigger / Click Action based on Slicer Selection (Presentation)
Hello community, I am inspired by the actions function and just wondered if you see a possibility that allows me to configure actions (i.e. jump to slide) which are triggered after selecting a…
- Answered
-
KPI Gauge formating
Hi, is it possible to remove word Status when visualizing KPI with Gauge Text visualization, I find possibility how to change Labels for Value and Plan but not for KPI name.…
- Answered

-
can we refresh chart or grid data automatically at run time?
I have created presentation to show chart and also created scheduler which updates the model every 5 min. I am not able to see the updated data on the presentation.…
- Answered
-
Calculation turns wrong after drill-down
Dear all, the automatically calculated percentage (Create Measure – Percentage of total) calculation turns wrong, if elements of different levels are shown.…
- Answered

-
How to remove Grid header deatils
I am showing data on below calculated grid and i don't want to show the grid header in presentation. How can i remove or hide this grid header details ? Regards, Mangesh Desai
- Answered
-
How to call or execute(take as data-source) an SQL stored procedure in pyramid analytics
hi all, I was trying to call an SQL stored procedure from custom query into pyramid analytics in below way. exec dbo.[Get_SalesdetailsPyramid] The statement is valid,…
- Answered
-
Can Admin see which reports Users have accessed?
Hi, Can the admin account see which reports specific users have accessed? Often times client users will ask me questions, but I don't know which report they've looked at specifically.…
- Answered
Content aside
Topic actions
Rate Pyramid today:
Please rate from 1-5 Stars and click on the Star
to register your feedback.


Pyramid 2023.12 Release Notes
Pyramid Tip of the Day
Discontinued OS Support for EOL Systems
Pyramid Learning Hub
Pyramid Tutorial Videos
Pyramid Support
Pyramid Help