
How to get Console logs and HAR logs from the Chrome browser DevTools
To analyze logs in case of an issue with the application (ie. Black Screen), in addition to the logs that the application writes (from the Admin console), we will need to review HAR files and DevTools logs from the chrome browser.
These logs can provide information about the client-side script that runs the application.
First - open the DevTools window of Chrome by pressing F12 or:

To get the console logs:
If it’s a client-side error then it's important to see the console errors as shown.
Click on the Console and you will see the errors. Click on "Save as" for each row and save it + send a screenshot showing the console.

To generate the HAR file:
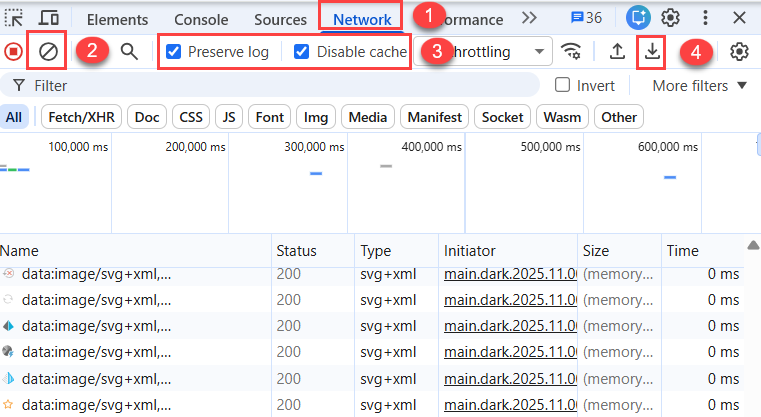
1. Open the Network tab in the browser Developer Tools.
2. Click the Clear button
3. Enable the Preserve log and Disable cache checkboxes
4. Reproduce the issue. Once the issue occurs, click the Download / Export HAR icon (down arrow) to save the HAR file.
1 reply
-
Hi, can you provide a similar walkthrough for the browser Firefox as it is more stable when developing in Pyramid?
I know that some colleagues from support@pyramidanalytics.com would also be interested in this

Content aside
- 2 Likes
- 3 yrs agoLast active
- 1Replies
- 2259Views
- 2 Following