
-
Discover: Latitude and Longitude With Layered Maps
Hello, I am currently trying to create some layered maps in Discover that overlay store location bubbles on top of an area map. Unfortunately, it seems like layered maps do not support using latitude…
- Answered
-
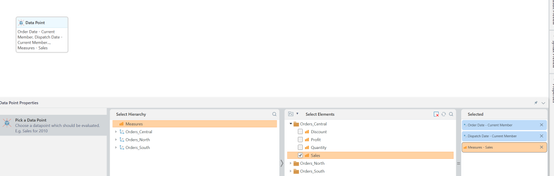
Dynamic “initial price” driven by a user-selected date filter
How do I calculate a dynamic “initial price” driven by a user-selected date filter? Background I have a receiving ledger with a few million rows of receiving entries.…
-
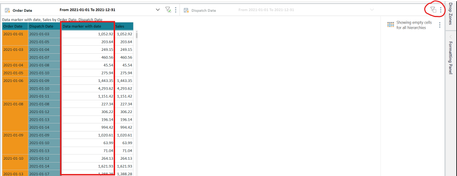
Need Help Creating Dynamic Previous Month Sales, Current Month Sales & Growth % in Pivot
Hi Team, I need help creating Previous Month Sales, Current Month Sales, and Growth % in a Pivot. I have: A Sales column A Sales Date column in yyyy-MM-dd format Initially,…
- Answered
-
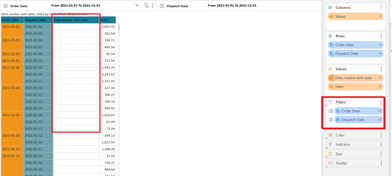
Error in interaction between two calendar filters
Hi all, i have the following problem - error in interaction between two calendar filters. How to reproduce the problem: 1) Create a calculated measure. 2) Create a visualization with two date filters.…
-
Only primary Y-axis shall be colored...
Dear Community, I like to have a simple combined chart: "SALES by PRODUCT CATEGORY" as stacked column on the primary Y-axis "MARGIN" as line chart on the secondary Y-axis So, it should look like this.…
- Answered
-
CSV Export Changes Column Order in Pyramid Discover/Presentation
Hi Team, Greetings. When exporting a CSV file from Discover or Presentation, the column order changes to a weird (non-alphabetical) sequence. I want the columns to export in the exact same order as…
- Answered
-
Top or Bottom X using a Parameter - TIP
Have you ever wanted to toggle between the top or bottom products, items, or whatever by a specific measure? Here is a simple approach to do so. 1. Start in Formulate and select a List. 2.…
-
General enhancement of Excel Export capability
Pyramid 2025.02 contains a collection of customer requests for the enhancement of Pyramid's Export to Excel capability. The following is a listing of these feature enhancement requests with a link…
-
Help Getting Stacked Bar Plot to Use a Consistent Set of Colors
I am building a discovery that is a paired stacked bar plot with the following characteristics: The X-axis is year. The Y-axis is a percentage of total annual insurance cost of workplace injuries.…
- Answered
-
I have calculated field as 'Average Time Spent.' Now I want to use that field as a filter in Discover or as a filter in other formulas.
I have calculated field as 'Average Time Spent.' Now I want to use that field as a filter in Discover or as a filter in other formulas. is this possible without writing anything in data model
- Answered
-
How to Customize Totals in a Grid
How to customize the totals in a grid When you add totals to your Grid Pyramid automatically adds the sum of the columns. Sometimes this does not give you the optimal result.…
-
Filter a second dimension based on the value of a first dimension in Discover
Contents Hi Community, Please bare with me whilst I try to explain what I am trying to achieve. This is a very slimmed down example, but suffice to say,…
- Answered
-
Let's talk about Dimensions and Measures
Dimensions and measures are the two central building blocks in multidimensional reporting. In Pyramid Analytics, they are mainly dealt with in the “Model” and “Discover” modules.…
-
How to get a Discovery Bar Graph to Sort by One Specific Group ?
I am attempting to build a bar graph displaying data segmented by two bars and I want to sort the bars by magnitude, but I want the bars to only sort by one specific category.…
- Answered
-
How to undo total column color formatting
I created a few discoveries and color formatted the total and Subtotal columns. I added color formatting to the rest of the table but was then told that this needed to be done in the Total columns as…
- Answered
-
2025 Feature Highlight: Tabulate 2.0
Tabulate 2.0 allows users to represent query results directly from discover reports - linked” Discover queries where the shape of the query can be changed through drop zones within Tabulate as well…

-
Selecting Multiple Dimensions at Once
Hey all, This is a simple question about whether a certain functionality exists in Pyramid. Is a user able to select multiple dimensions and add them simultaneously?…
- Answered
-
2025 Feature Highlight: Quick Sort Wizard
The quick sort wizard allows more sophisticated sorting including sort by and then by nested sorting, as well as better support for hierarchical sorting.…

-
2025 Feature Highlight: XIRR Financial Calculations
There is a new set of financial functions available that add functionality, flexibility and ease of use in creating more sophisticated calculations to better support financial analytics and reporting.…

-
Filtering on 2 dimensions and counts
Hi community, I am struggling to do something that I think should be possible so asking for help here
 I have a star schema modelled in snowflake and a Direct Query model in Pyramid consisting of a…
- Answered
-
Default theme not pre-selected
Hi, I have created a new theme (circled below) and made it the default within my pyramid environment under the admin settings, however when creating a new present / discovery the old default theme…
- Answered
-
2025 Feature Highlight: Lasso Maps
The lasso tool has more enhanced capabilities, including freeform areas, with added geospatial analytic functions, allowing users to draw boundaries around desired content,…

-
2025 Feature Highlight: Layered Maps
The product now supports for multiple map layers, where you can have a combination of maps representing different data, for example, color coding an area and overlaying coordinate point information,…

-
2025 Feature Highlight: Advanced Composite Filtering
Advanced composite filtering allows the user to construct more complex rules for filtering. Just like a simple comparison of values, advanced filtering supports compound filtering options where…

Welcome to the Pyramid User Community
Pyramid User Community