Filter a second dimension based on the value of a first dimension in Discover
Hi Community,
Please bare with me whilst I try to explain what I am trying to achieve. This is a very slimmed down example, but suffice to say, the actual implementation is a star schema with Primary / Foreign keys etc
I have a fact table that contains premiums and I need to display these premiums in a actuarial triangle.
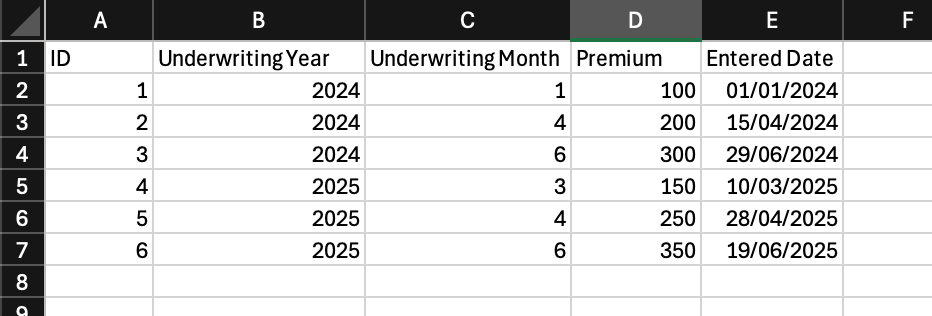
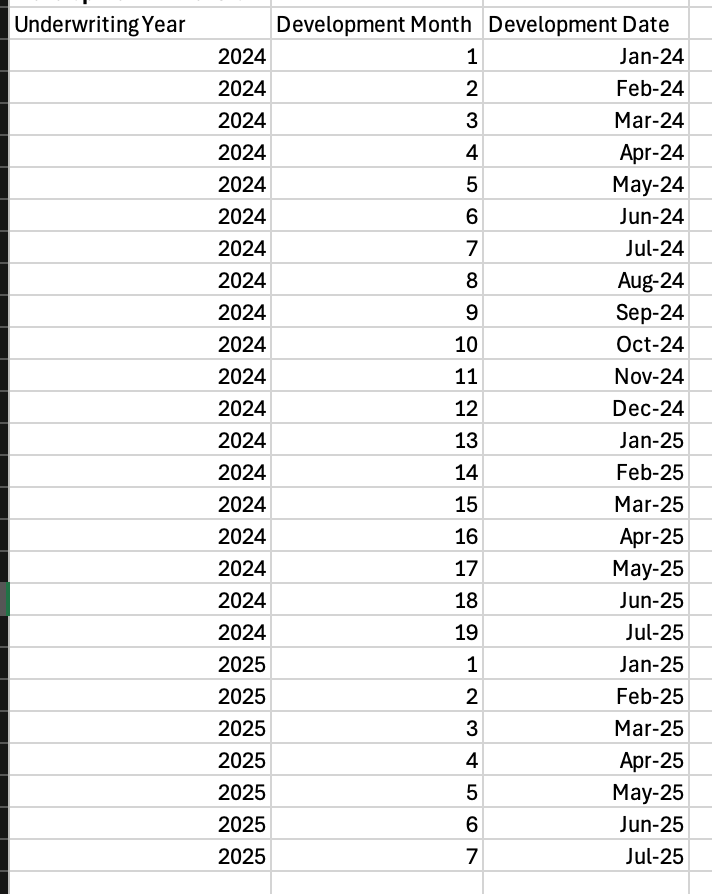
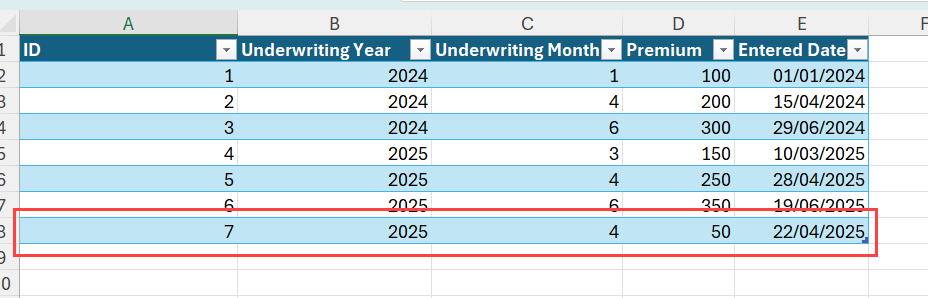
The fact table looks like this:
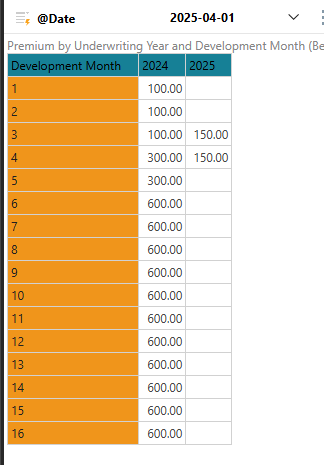
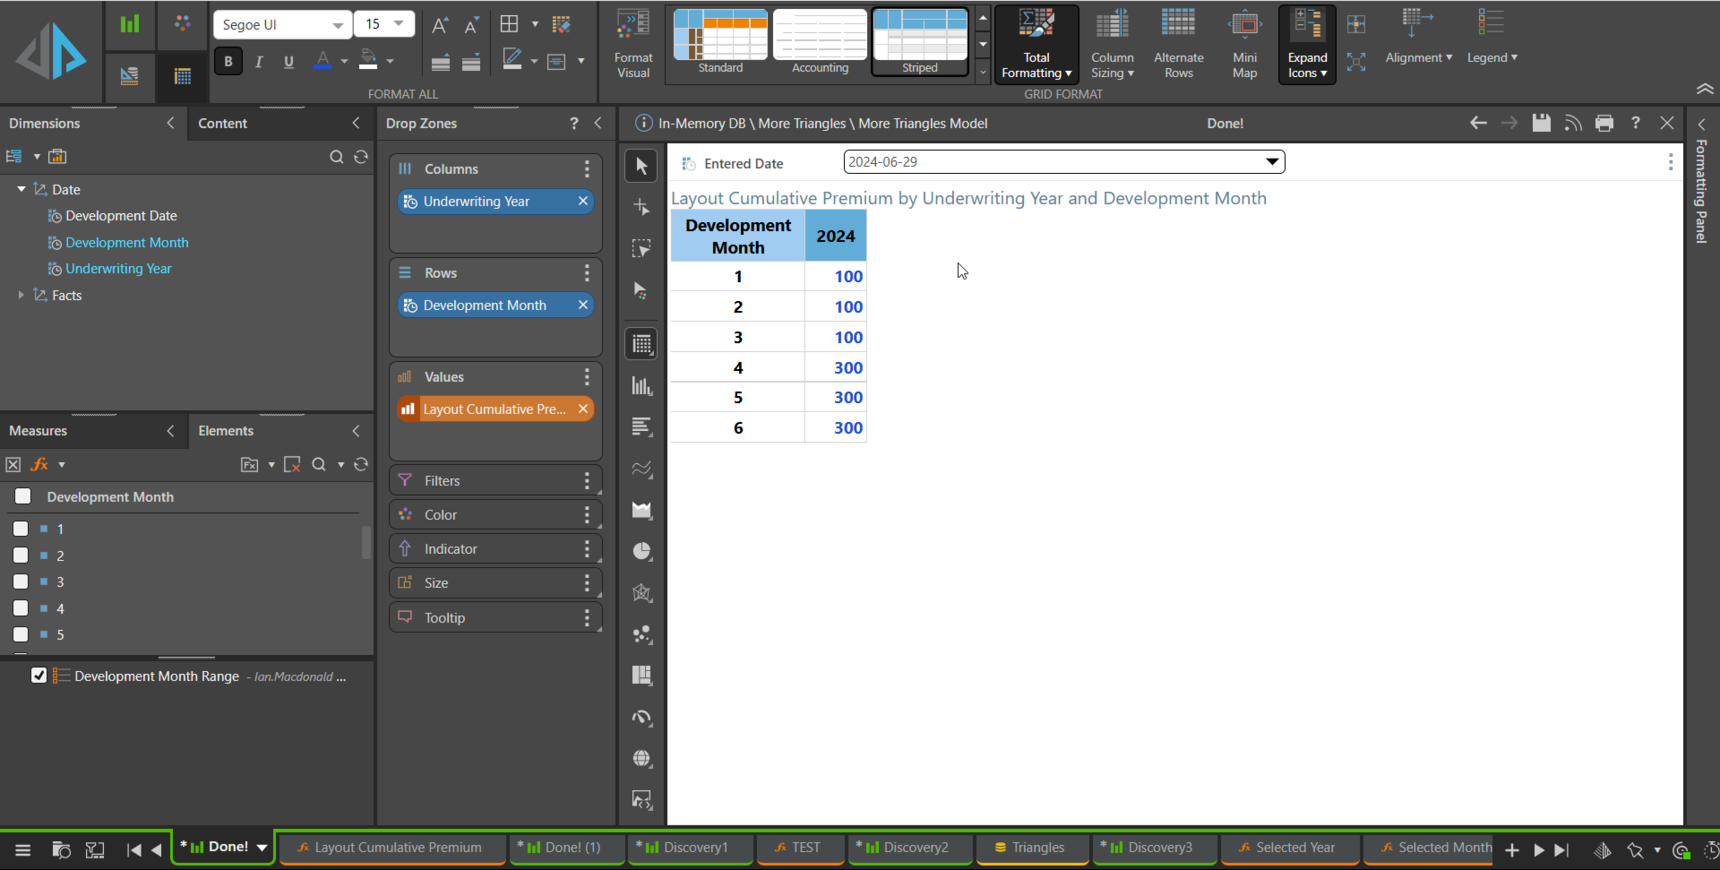
The Discover would look like this; Underwriting Year across the top and Development Month down the side. Each development month is the month number from January of the Underwriting Year, and the measure is the running sum. In this example there are 19 Development Months for UWY 2024 (Jan 2024 -> Jul 2025), and 7 Development Months for UWY 2025 (Jan 2025 -> Jul 2025)
Correct Triangle up to Jul-2025
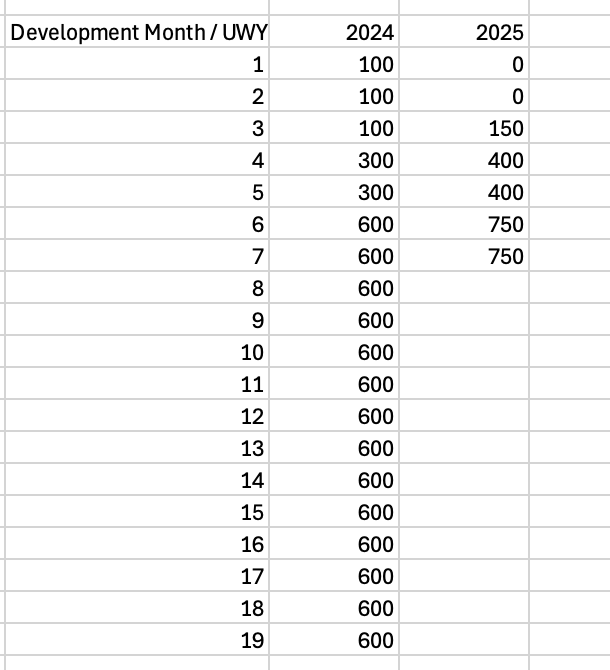
In UWY 2024, for the first 3 months, the running sum is 100 as this relates to the Record ID number 1. Record ID 2 was recorded on the 15/04/2024 so in Dev Month 4 of 2024 we add 200 to give us the running sum of 300 ... etc.
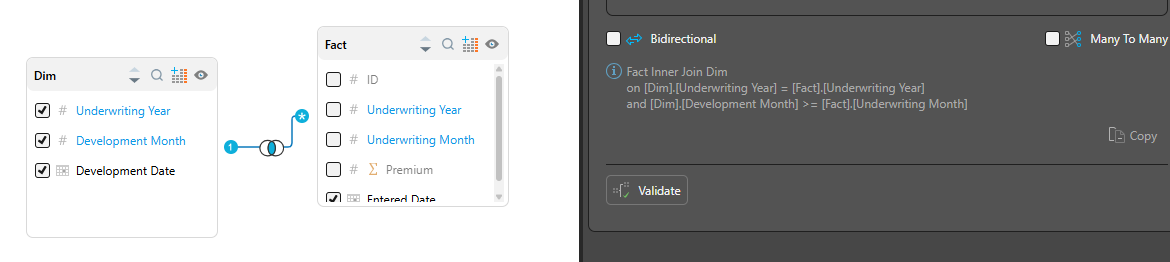
I have modelled this in Pyramid by having a Development Month Dimension that contains Underwriting Years and Development Months up to and including the current month, and joining this to the fact using a non-equi join
FACT.UnderwritingYear = DIM.UnderwritingYear AND FACT.UnderwritingMonth <= DIM.DevelopmentMonth
This correctly gives the triangle as shown in the second diagram above.
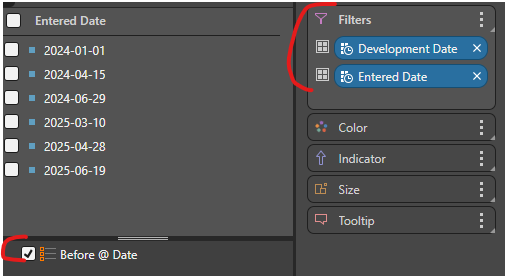
My challenge is that there is a requirement to be able run the triangles report at an AS-AT Date. For example, by selecting an AS-AT Date of 01-Apr-2025 Pyramid should do 2 things
1. Filter the fact table to only include transactions that were entered before 01-Apr-2025
2. Only display development months 1 to 16 for UWY 2024, and development months 1 to 4 for UWY 2025.
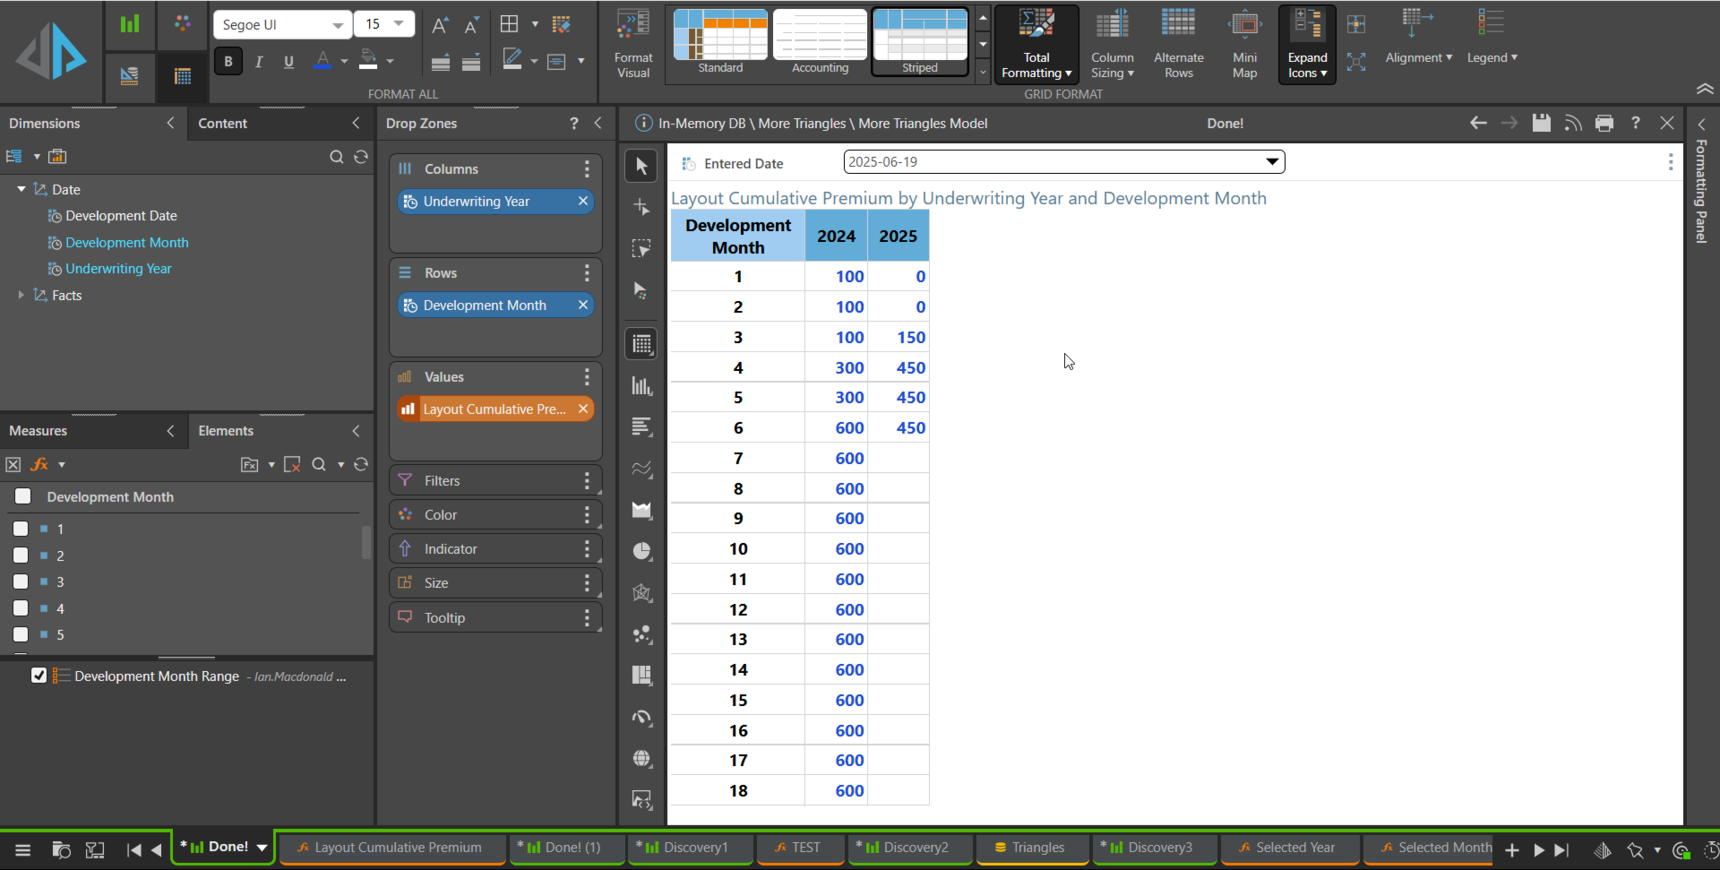
The final report should look like this
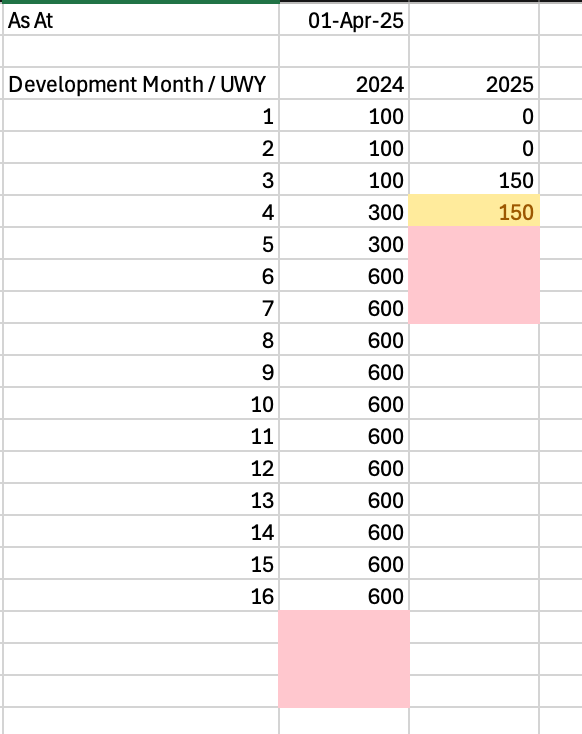
The RED highlights show the development months that are have been removed when comparing to the original report as they are beyond the AS-AT date, and the Yellow highlight is showing that the running sum for Dev Month 4 is now 150 instead of 300 as Record IDs 5 and 6 have been filtered out as they were entered after 01-Apr-2025.
I am struggling to present to the user a single filter that can both filter the entered date and the development month dimension, which suggests that my model is incorrect or I am missing something. Does anyone have any suggestions.
Many thanks for your help
Malcolm
13 replies
-
Hi
Could you post here your excel sheet that contains the data used in your example above? Or more if you have it. I can then replicate your model and see if I can provide an answer.
Meanwhile, take a look at these posts to see if they help at all:
https://community.pyramidanalytics.com/t/g9hfd0f/how-to-create-a-loss-triangle-in-pyramid-analytics
https://community.pyramidanalytics.com/t/y4hdbq4/dynamic-year-range-on-loss-triangle
Thanks,
Ian
-
Hi
This is quite tricky. The triangle bit is straightforward (BTW a simpler Left Outer join on the Year and Month is all that is necessary), but the "As at" filtering is a bit of a 'mare!
You will definitely have to create a new Measure as the Measure value is dependant on which Year column the value lies. For example, if you are setting an "As at" date of some time in March 2025, you do not want any cumulative calculations in the 2025 column to continue past Development month 3, but in the 2024 column they need to go on to Development period 15 or whatever. so the calculation is different in different columns for the same row.
I'll revert when I have a solution.
Cheers,
Ian
-
Hi
Ok, buckle up because this is going to be a wild ride!
Let’s take a step back and consider the problem. While the Date dimension has Development Months 1 – 19, a soon as you filter on Entered Date, it will only ever show the Development Months that occur for the dates selected, regardless of the JOIN because you have filtered them out.
Additionally, we need to suppress the Development Months and Underwriting Year depending on the Date Entered chosen. We need some kind of mechanism to determine what Development Months and Underwriting Years to show, based on the Date Entered that has been selected, without directly filtering on Date Entered.
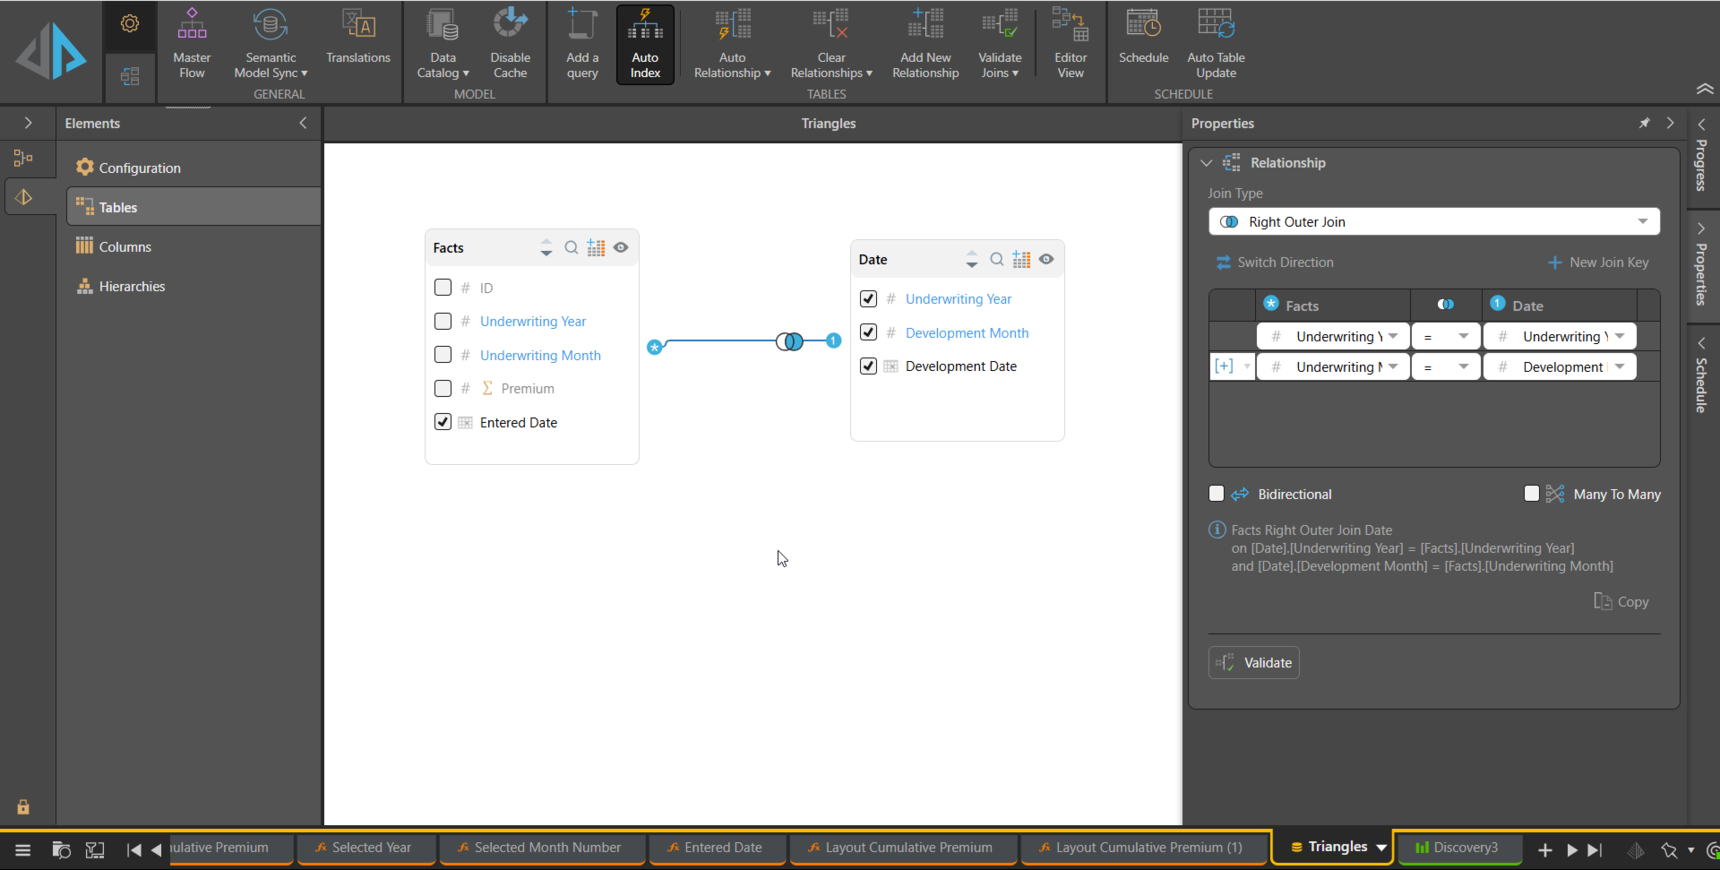
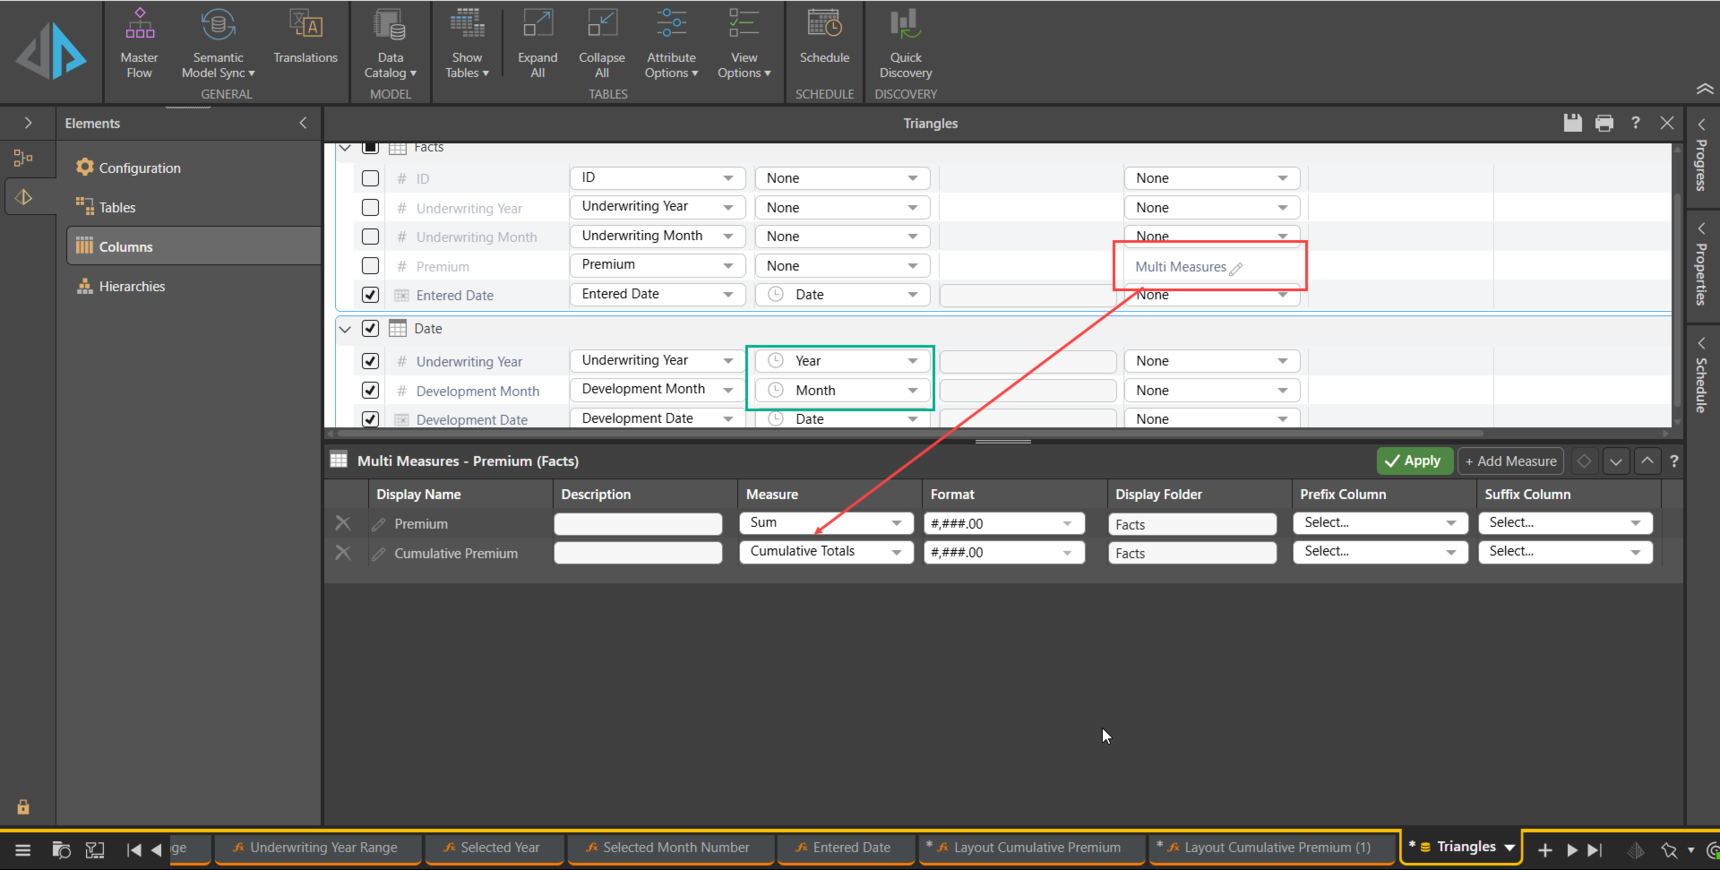
We’ll get to how that is done shortly, but first, I’ve changed your model by setting a right outer Join between the tables, so I can get all the Development Months I need, regardless of whether there is a Premium value present.
I’ve also set multi-measures on Premium to give a SUM and a CUMULATIVE aggregation. Note also that Development Month and Year are set to Date types Month and Year respectively so that the cumulative aggregation will have a time hierarchy to work against and so that I can use Date functions on them.
Now for the magic.
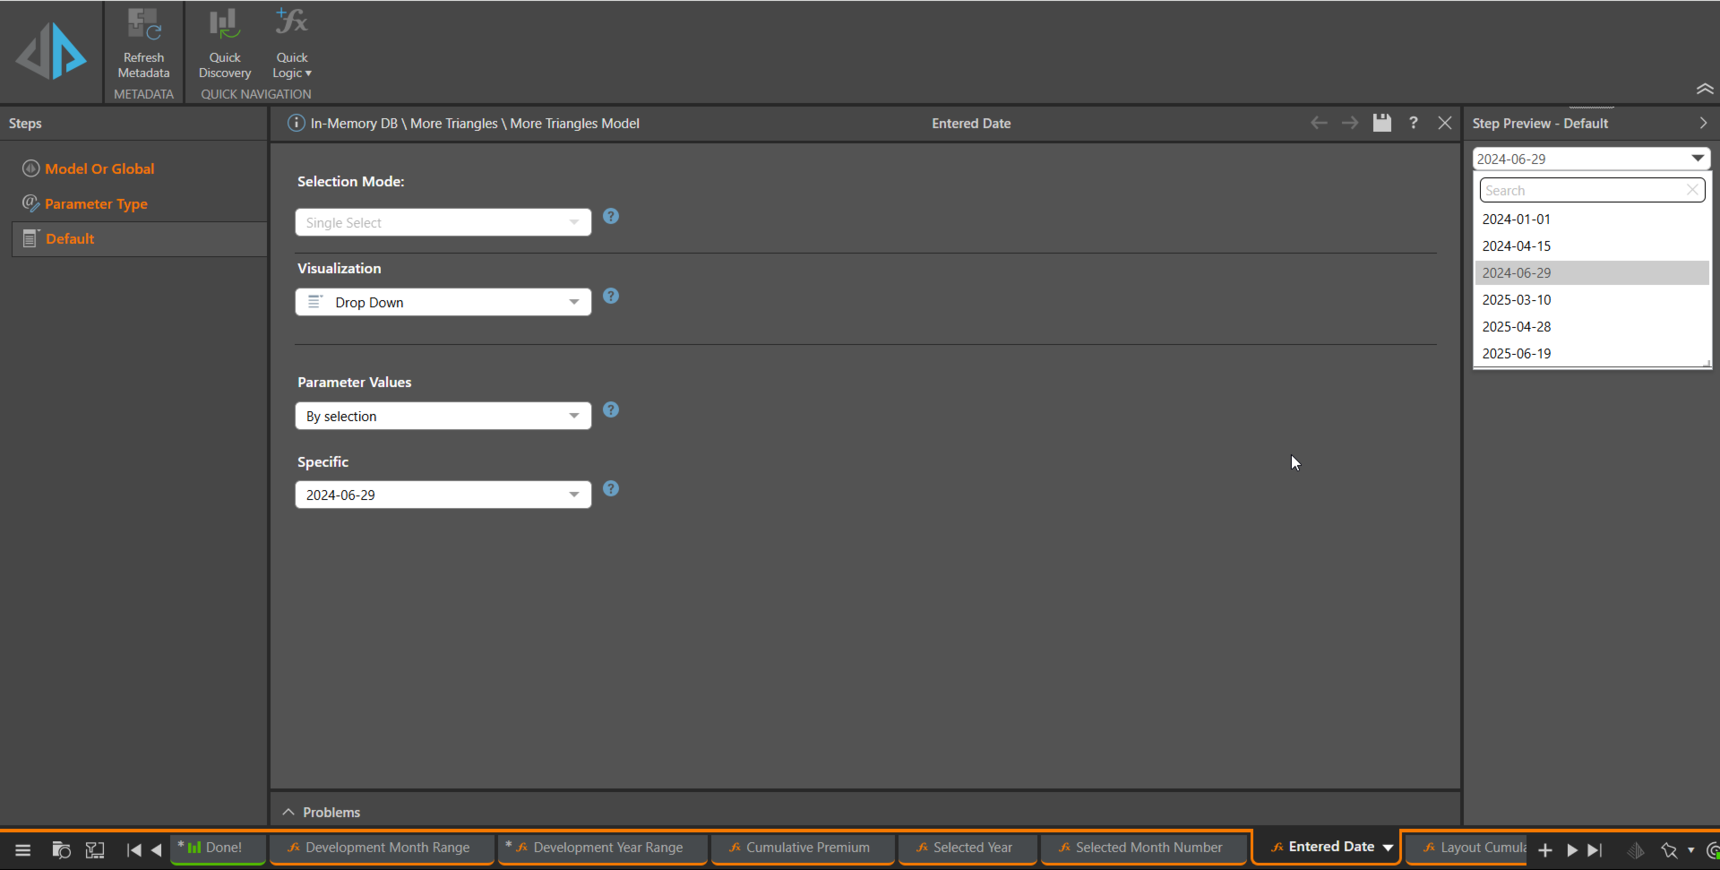
Everything we do will be based on the Date Entered that has been selected, so the first thing to do is create a Parameter on it. I've set the default to be in the middle so I have a good default value when I'm testing stuff.
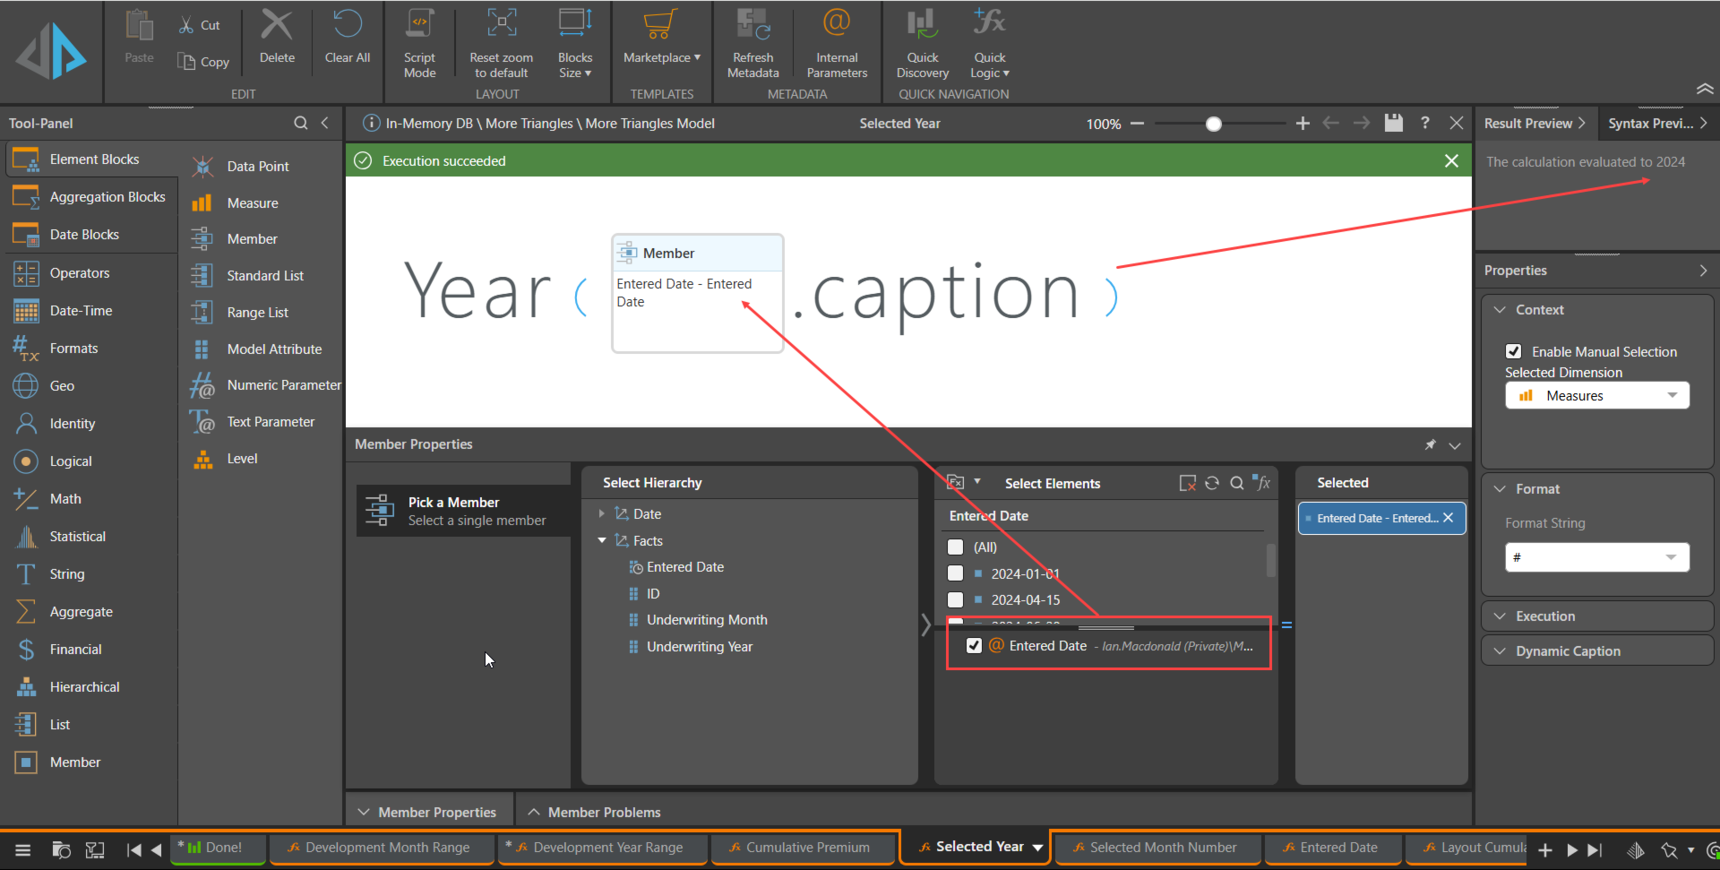
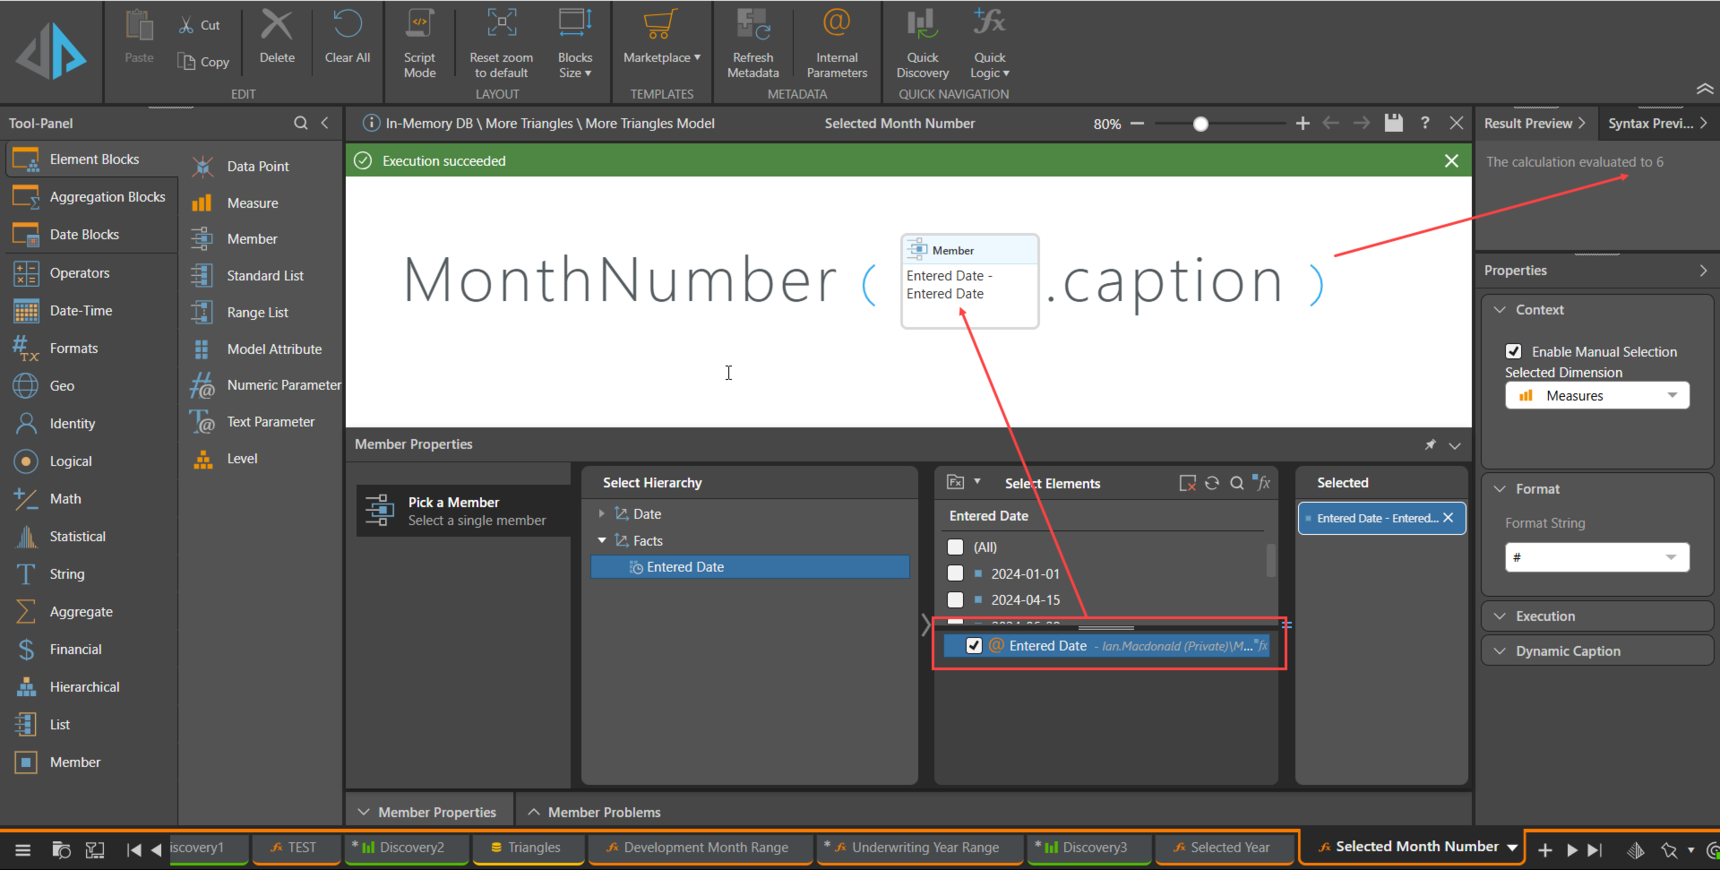
Now, we need to identify and use later the Development Month and Year from the Parameter value selected. Create Measures from the Parameter by pulling out the caption. So, if I selected 2025-04-28, the Development Month Measure will be 4 and the Year Measure will be 2025.
I now need to set the range of Development Months and Years to be shown. As I chose an earlier Date Entered in 2025, the Development Months shown for policies in 2024 need to be decreased to give the accurate “As at” view. Similarly, if I select an Entered Date from 2024, I don’t want to show the 2025 column.
Create a dynamic list for the Years by using the RANGE function from the first Year (using the OpeningElement() function on the Year hierarchy) to the Year from the selected Date Entered, using the Year number Measure. We'll have to drop down to Script Mode to do this.
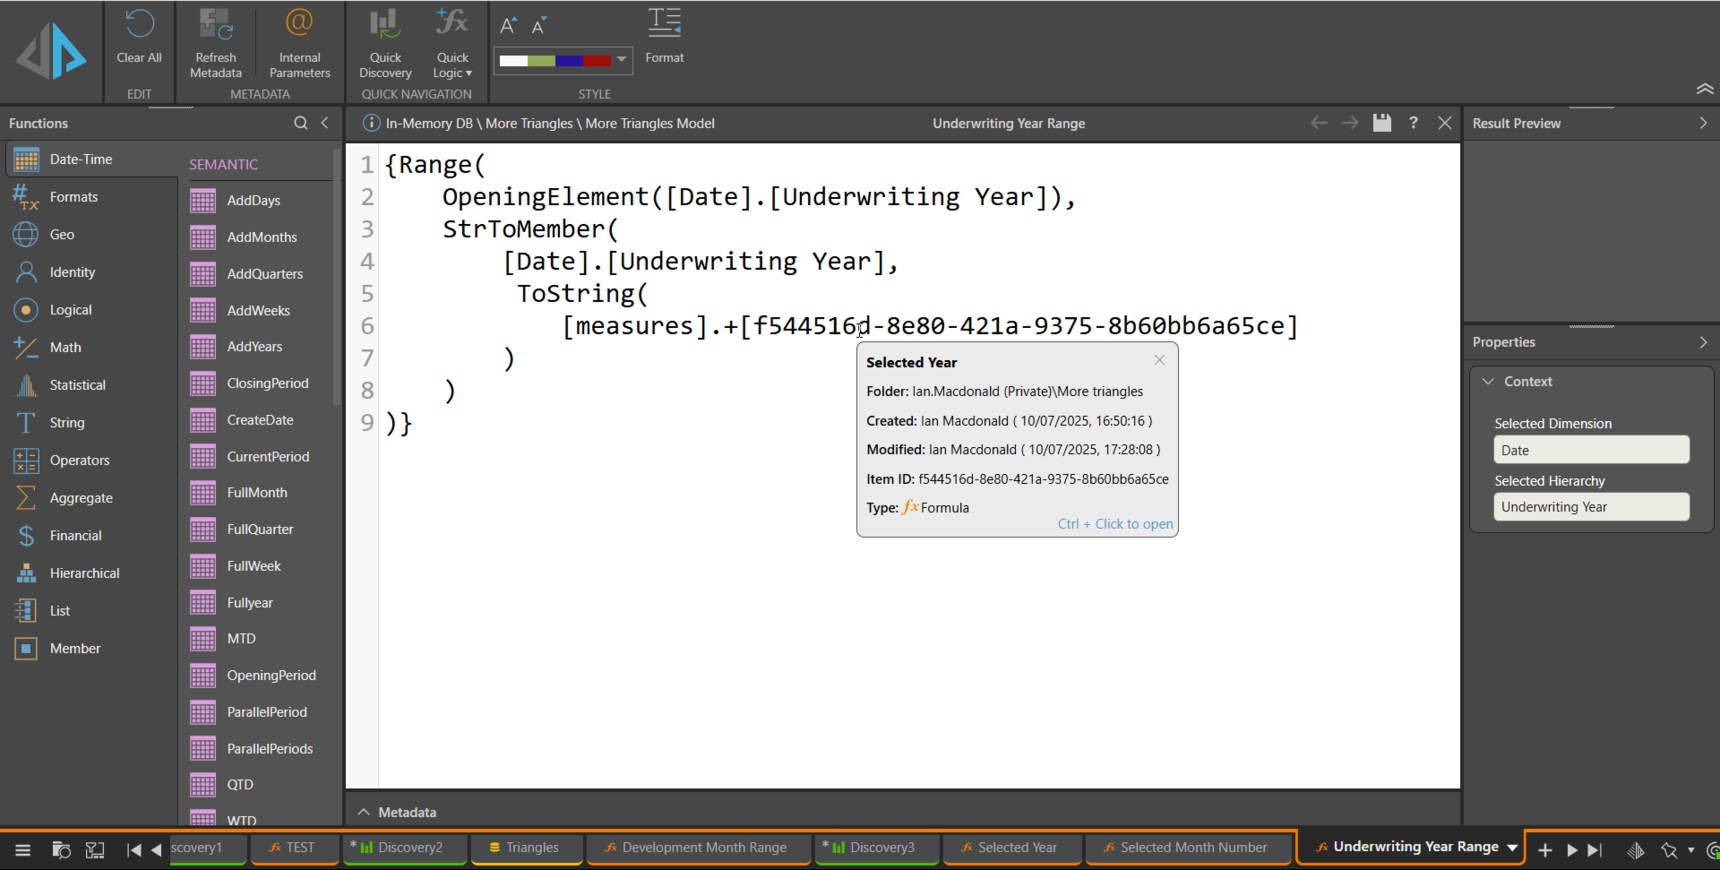
The ToString() function converts the Measure containing the Year number to a string, then the StrToMember() function returns the Year Member matching the string "2025".
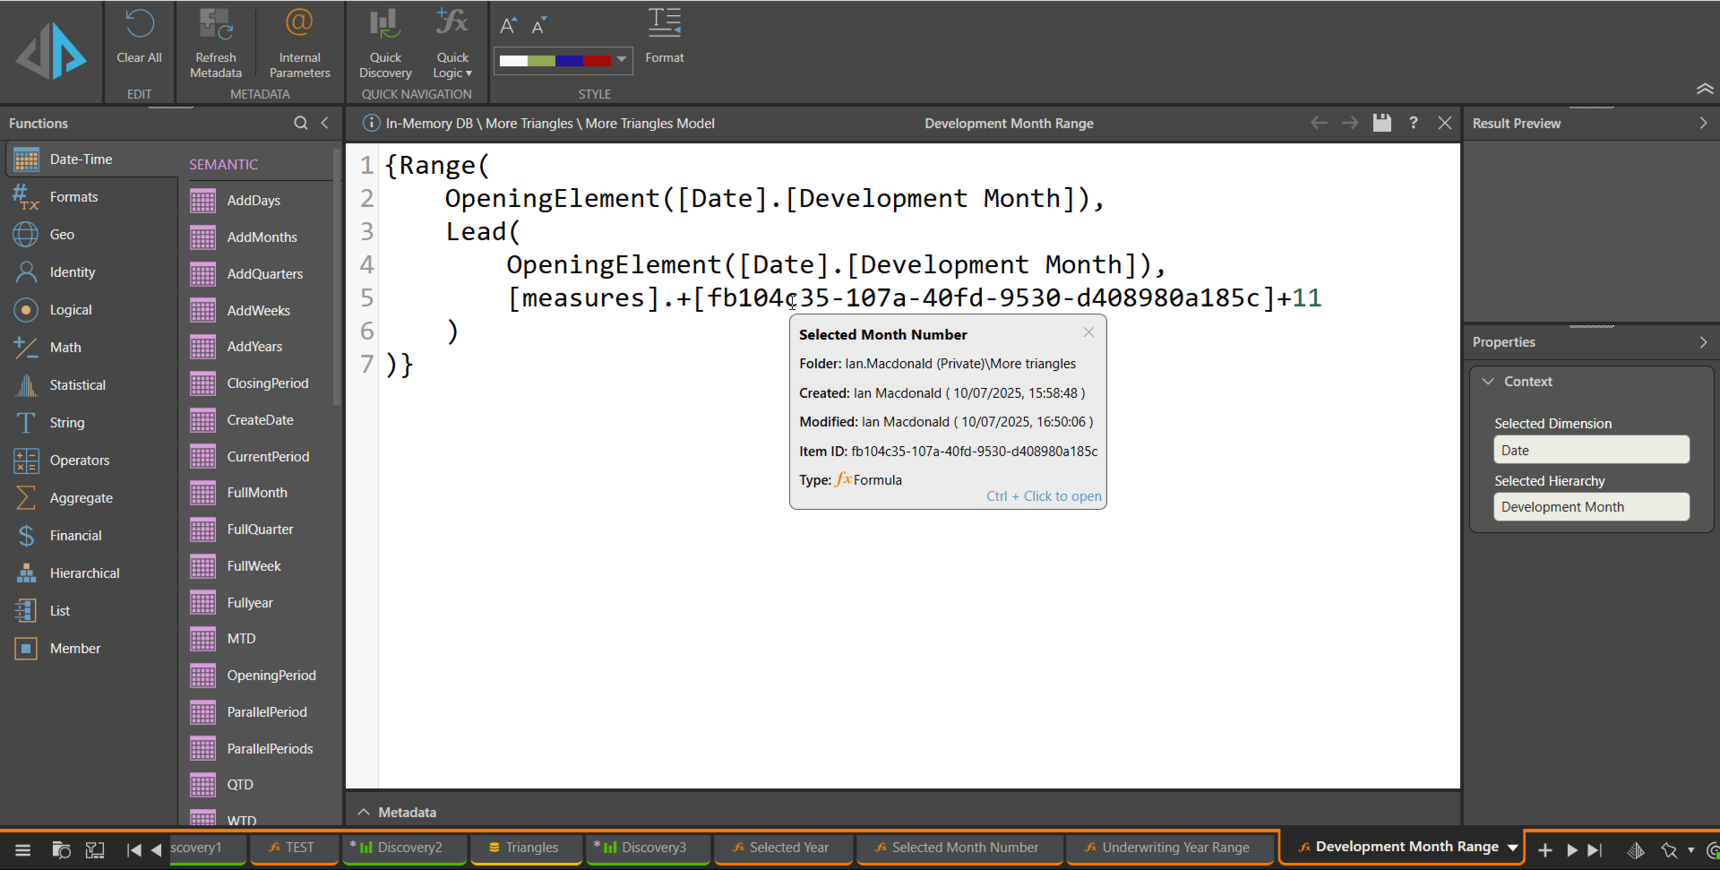
Similarly for Development Months, except this time we need to add on Development Months for prior years than the one selected, reflecting the Development Month from the Date entered that was selected. We can use the OpeningElement again for the start of the range then the value of the selected Development Month plus 11 to generate the whole list of Development Months up to the selected Date Entered. As we change the Date Entered, the list will shrink and grow as I select earlier and later Date entered values.
Now for the complicated bit (the stuff before wasn’t? LOL), deciding what value to show in which cells of the grid based on the Date Entered selected.
Let’s consider the rules.
For any Year/Development Month greater than that selected, we want to suppress the Cumulative Premium.
For the Year/Development Month selected we need to aggregate Premium for all dates BEFORE the selected Date Entered. Although your example data didn’t contain any, there may be Date Entered values before the one selected, but in the same month. So we need to aggregate the Premium up to the Date entered immediately before the selected Date Entered. We can use the Lag() function to find that from the Parameter.
For any Year/Development month that has no cumulative Premium value prior to the first value before the selected Date entered Year, we want to change the null to a zero.
Otherwise, show the Cumulative Premium.
Phew!
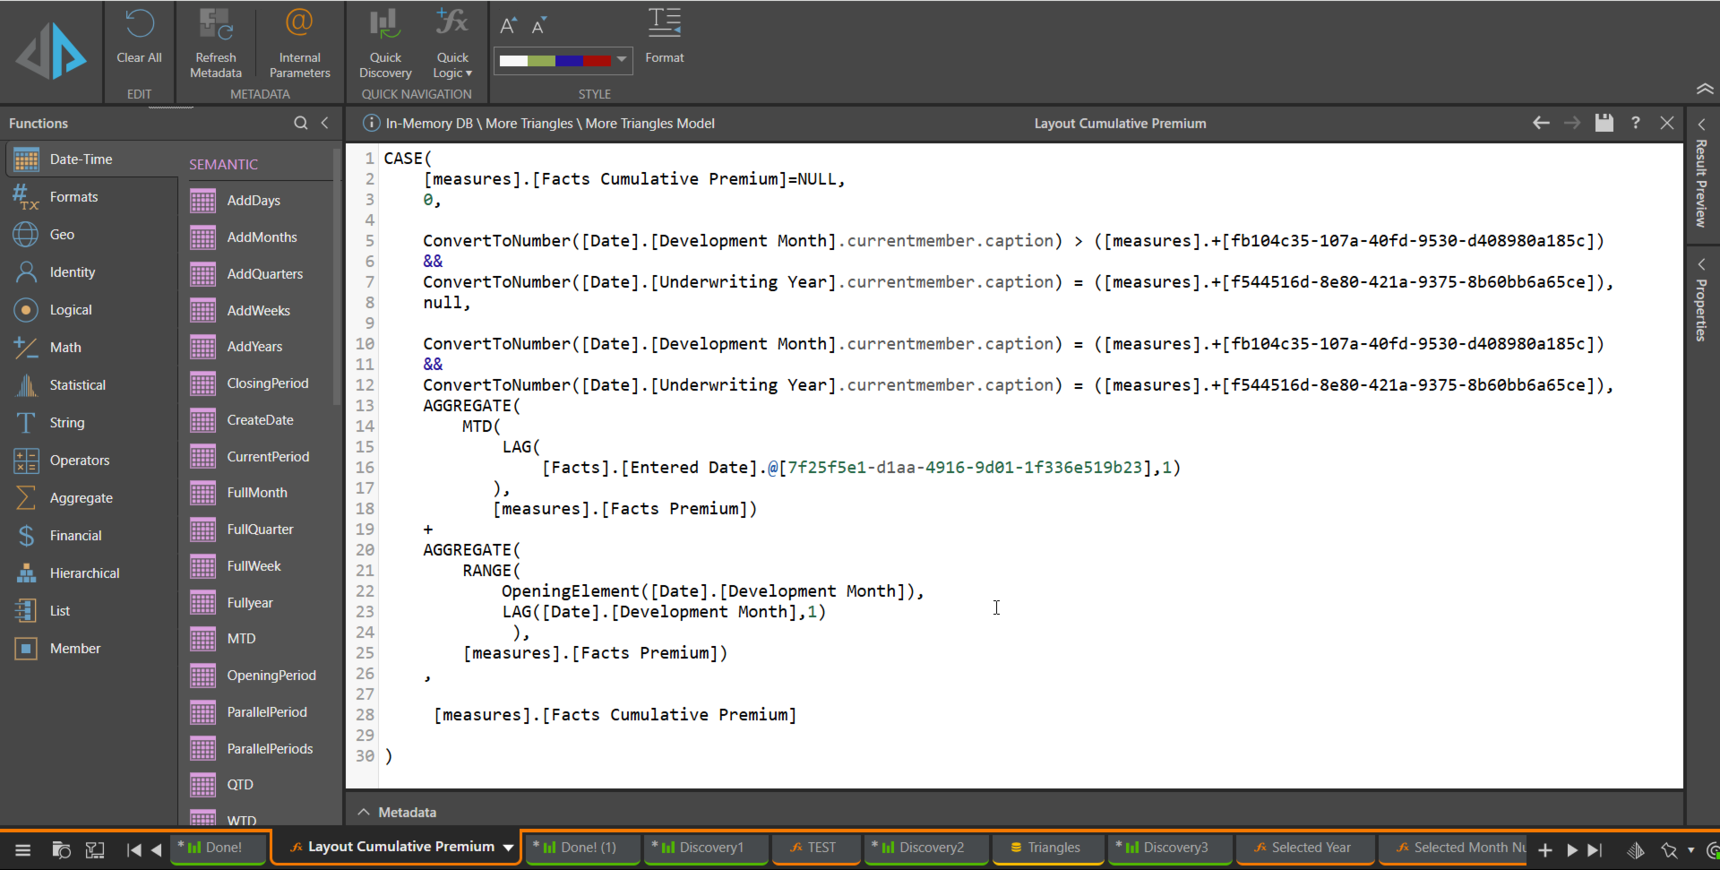
Rather than nested IF statements, we’ll use a CASE() function. There is some messing about with converting the Month number and Year number to text and matching it to the hierarchies concerned, hopefully you can follow that.
Also, my calculation for the currently selected Month and Year is a bit of a workaround as I found a weird glitch using Lag() (which I'll go talk to the developer about), but it works.
Now to put it all together. Put your Development Months on rows and select the Month Range set (deselect all the standard members). Same for the Years on Columns. You’ll see the Date Entered Parameter brought in automatically as the sets are dependent on it.
Add the Measure, I’ve called it Layout Cumulative Premium.
I added an extra record to your example data so that I could test the scenario where there were two Date Entered values in the same month


Bingo!
It’s been a bit of a journey but I think it is followable!
I've put the PQL script for the Month and Year ranges and the Layout Cumulative Premium in the attached text file.
Hope that helps!
Ian
-
Wow - thank you . I will digest and come back with any questions.