
Dashboard Gallery: Hexagon Manufacturing Demo
Management Dashboard for a Manufacturing Company
This dashboard has been developed as a sample to show case the use of a highly formatted dashboard as a quick way to give management a good overview of the daily operations. It consists of three Panels that can be clicked on the right side.
Start Screen:

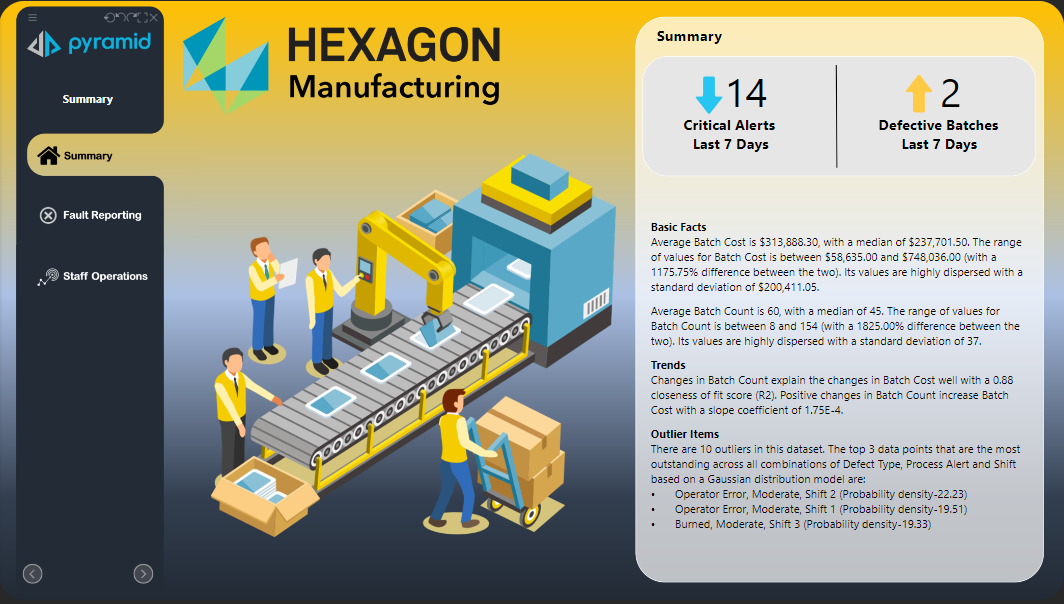
The Start Page offers a quick menu on the left so users can jump directly to the required detail analysis. On the right, they get a top level summary.
Critical Alerts (Down) and Defective Batches (Up) the start page also holds a dynamic text driven by the reports and providing a summary of basics and identified trends.
Fault Reporting

Fault Reporting offers a deeper insight in the Production Process and sources of defective Product. The data can be tailored with a Date Slicer, and a Radio Button on the top right to fine tune the analysis.
Below the initial two slicers are four reports that give the user an overview about key KPIs.
- Trend Graphic in a Table, combining key numbers over the past 8 month and trends.
- A visual summing up four Main KPIs
- Bullet Charts to see the main Causes and
- A Bubble Chart as a representation if the monetary volume of the defective Batches per Product
On the right are two larger reports that detail operations Metrics for the four Product Categories and also a projected forecast based on the analysis of the existing data.
Below is a chart that gives an overview about the severity of failures in the Processes during the shifts, molding seems to be a key cost driver.
Using analyze further a Manager could use this to build even more detailed reports or use bookmarks to quickly come back to certain setting when looking for causes of error.
Staff Operations:

Finally the Staff Operations tab, offers all relevant information about the current staff situation. With the information of the pages before, the process and fault analysis, the manager now can identify certain processes and/or assign them to individuals that need deeper training.
This data could come from internal sources like the HR System or e.g. a SAP Environment.
With three simple steps management can now drill from an overview into detailed information and derive valuable information to improve the quality of the product.
Learn More
Learn more about Reporting and Dashboarding in our Learning Live Sessions about Present
Dive deep into this topic with Training in the Learning Hub: https://learn.pyramidanalytics.com/
Want to learn more about the tips and techniques used to develop this dashboard ask a question in the Q&A and mention this Dashboard and one of the Pyramid team experts will help you out.
3 replies
-
Hello Christian,
Can we download this dashboard and open it in our own Pyramid Analytics environment? -
Hi Önder,
sorry for the delay. You can now access a slightly altered live version of this dashboard on the Explore Server.
https://explore.pyramidanalytics.com/direct?id=24f61d79-2856-46bc-bbe2-197c1a8e07e3&slideNumber=1Hope this helps
Christian