
0
Discover Chart Axis Options For Multiple Measure
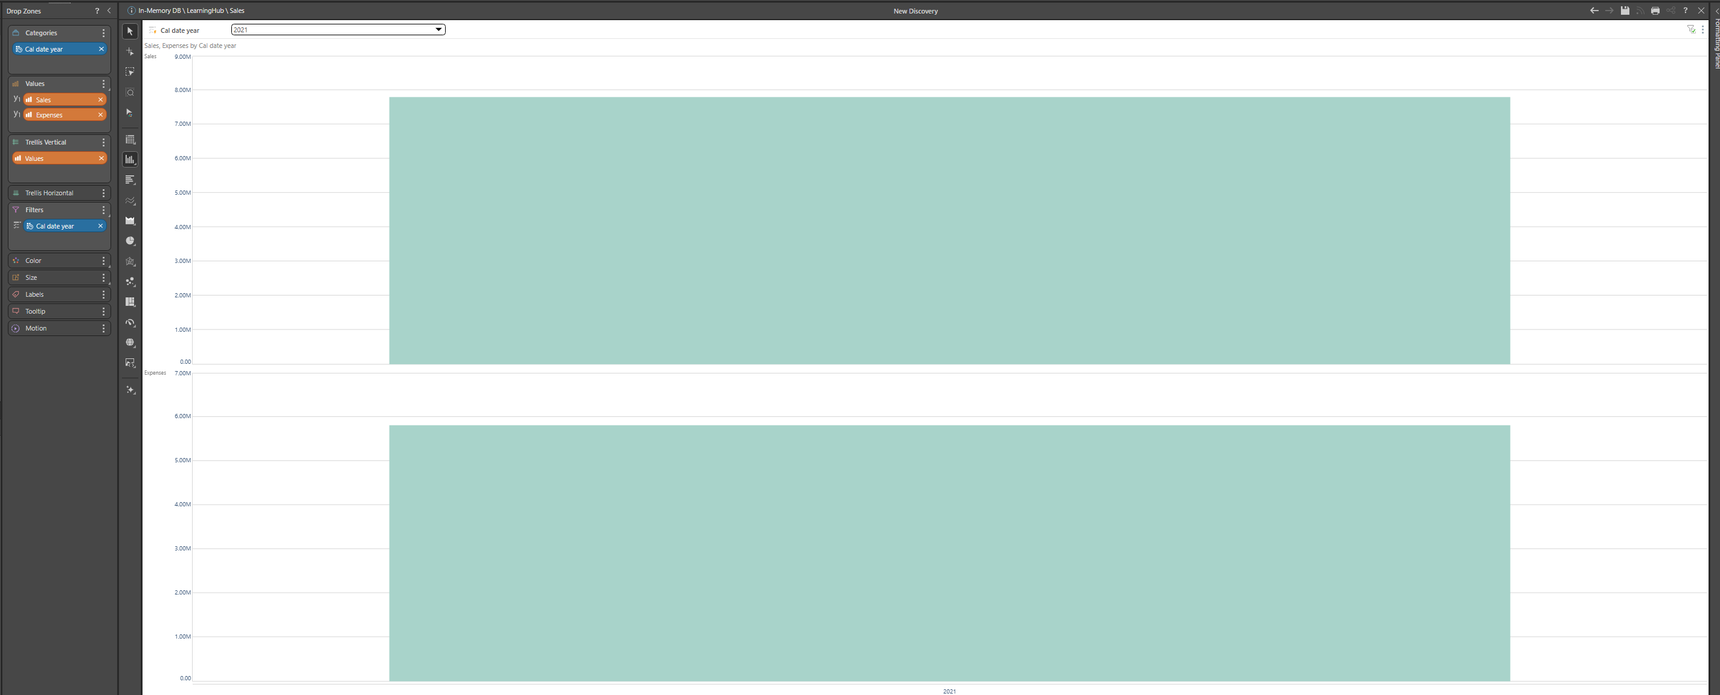
Based on the image I have attached, I have a scenario in which I am creating a chart with more than one measure. It puts the measures on different charts which is what I want. It just that when I click on the common axis option, the y-axis is still not the same scale (top chart goes from 0-9M while second chart goes from 0-7M). I want a chart in which everything is the same scale (0-9M on both charts for example).
1 reply
-
The common y-axis, keeps a common y-axis scale between trellised charts with the SAME measure. It does not work across different measures.
Even though this is an unusual request, we have solved it by either manually setting the axis scale in the properties or, putting both measures in the same chart on the same primary axis.