Pyramid Explore #6 - NFL Super Bowl Climatology Showdown

 The Challenge
We’re giving you access to climate data from every Super Bowl since 1967 — temperatures, conditions, locations, and more. Your mission? Put your analytics skills to the test by creating reports and dashboards using the Pyramid platform to uncover trends, insights, and stories hidden in the data.
 What to Explore (just a few ideas!)
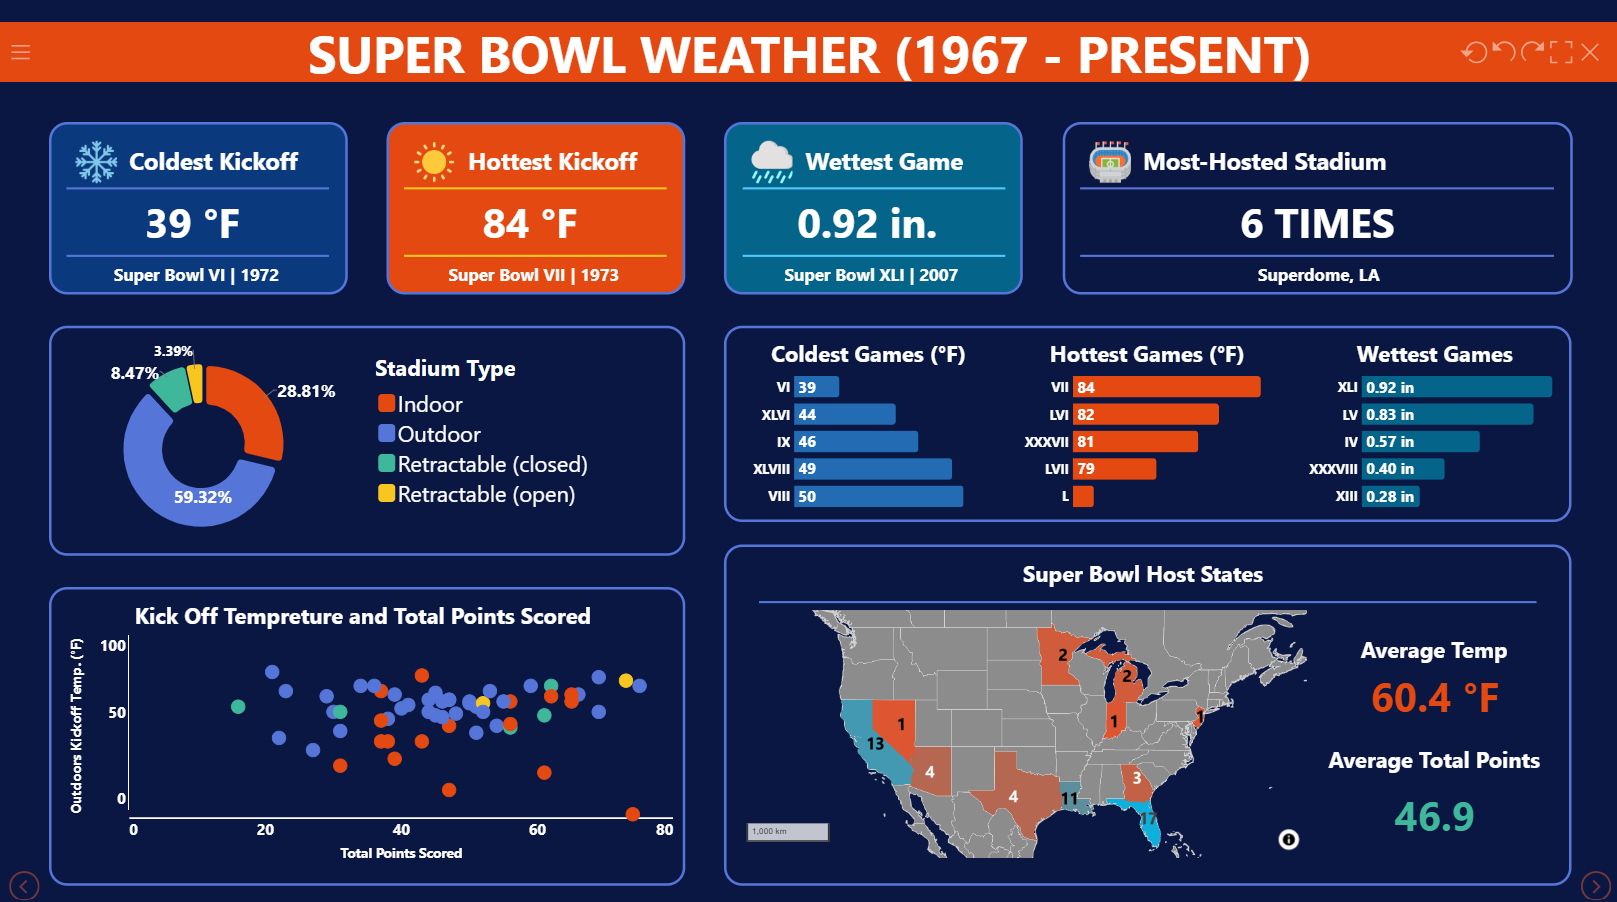
Coldest vs. warmest Super Bowls


Weather trends by location or decade
Does climate favor certain regions?
Any surprising patterns over time?
Get creative — there’s no single “right” answer.
Whether you’re a seasoned pro or just looking to experiment, this challenge is all about learning, creativity, and having fun together.

 Ready to kick off?
Let the data play begin — and may the best dashboard win!
 Drop a comment if you’re in, and keep an eye out for the dataset and submission details.
14 replies
-
You will find the model in the Explore Server. Create a report and you should be able to see the IMDB below, ready for you to use. Have fun!
-
Its super cool every year!
-
How to Download Data??
-
I would be in - just started to fiddle around with the data...
Not that I think combining weather and geodata makes any sense whatsoever, but: Are the geo-maps on Explore actually activated and operational? Question for a friend. -
SuperBowl is this Sunday
 How is everyone doing with their dashboard solution? ? I'll be picking a winner by Thursday next week, excited to see what you all have created!
 -
, and here is my mine, just in time before overtime.

I copied my dashboard (i.e. the Present file) ride beside Kelly's in the Community Data Challenge folder of Explore. I don't know if it can be executed there, as the dependent files are still in My Content folder. But you'll manage it!
THANKS for the Challenge!
That was fun - and much more work than intended...
Micha -
Thanks for participating! I will review this and make an announcement by tomorrow morning! Thank you again, you're both awesome