Pyramid Explore Challenge #7 - Milano Cortina Edition - Challenge Detail


 The Challenge
We’re giving you access to Winter Olympics data — medal counts, athlete stats, country performance, historical trends, host city details, and more. Your mission? Put your analytics skills to the test by creating reports and dashboards using the Pyramid platform to uncover trends, insights, and powerful stories hidden in the data.
From the slopes to the skating rink, there’s a goldmine of insights waiting to be discovered.
 What to Explore (just a few ideas!)
 Medal trends over time — which countries are rising or declining?
 Country performance by sport — who dominates the ice vs. the snow?
 Breakout athlete performances or record-breaking moments
 Host country impact — does home advantage really exist?
 Historical comparisons across decades
Any surprising patterns hidden in the numbers?
Get creative — there’s no single “right” answer. The most compelling insights and visually engaging dashboards will stand out.
Whether you’re a seasoned analytics champion or just warming up, this challenge is all about discovery, creativity, and a little friendly competition.
Ready to go for gold?
Let the analytics games begin — and may the best dashboard win!
 Drop a comment if you’re in, and keep an eye out for the dataset and submission details.
1 reply
-
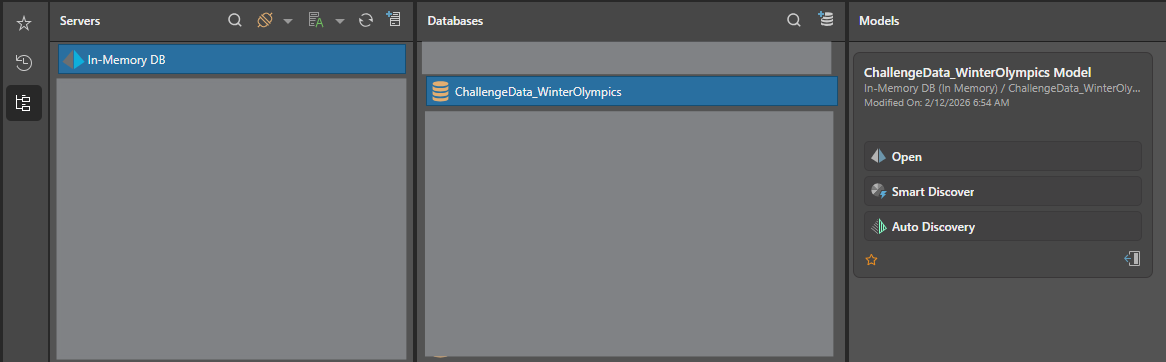
You will find the model in the Explore Server. Create a report or dashboard and you should be able to see the IMDB below, ready for you to use. Have fun!