
Dashboard Gallery: Retail demo with Google Form
Retail Analytics with embedded Google Form for Write Back
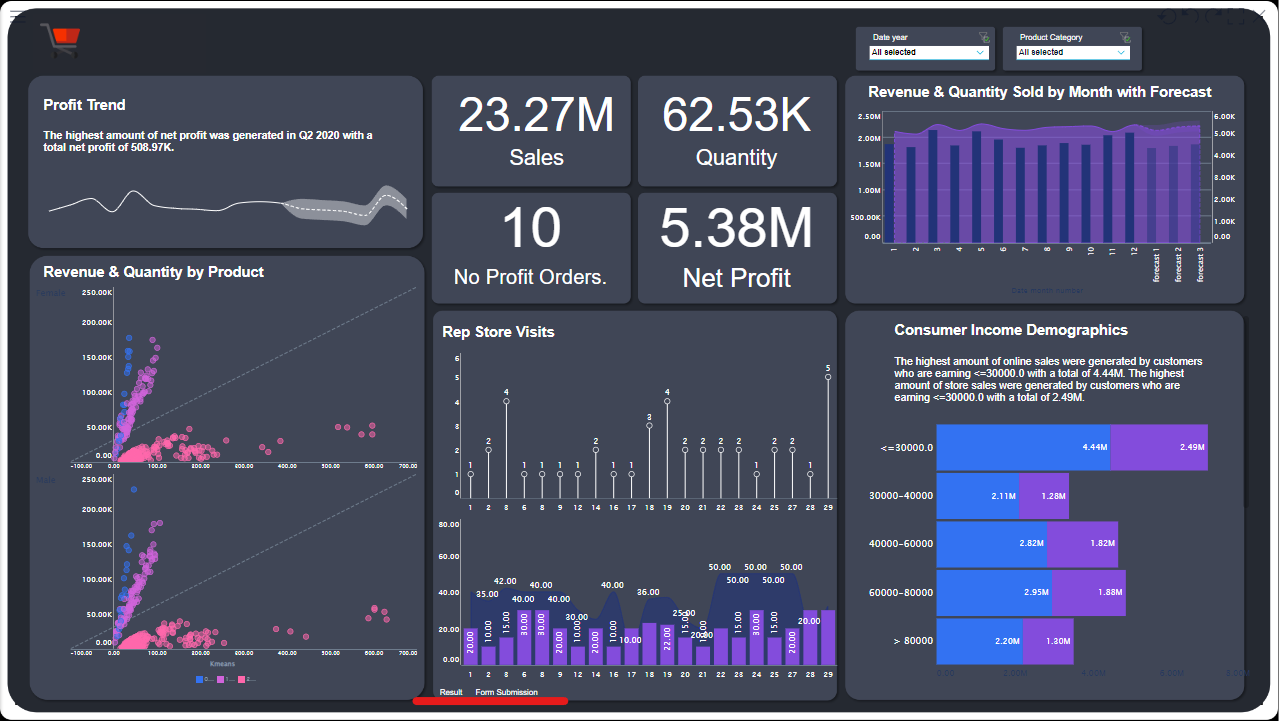
At a first glance this is a typical retail dashboard, as it would be used by a Sales Rep on their Daily visits to a number of stores.
Start Screen:

The Panels consist of six individual reports, covering:
- Profit Trend including a 6 Month Forecast
- A scatterplot with Revenue and Quantity by Product.
- A centerpiece with four key KPIs, and below that
- more details about the Number of Store visits below
- on the right then Revenue&Quantity sold by Month incl. a forecase
- and finally an overview of the income Demographics for the store visited
First additional Hidden Gem
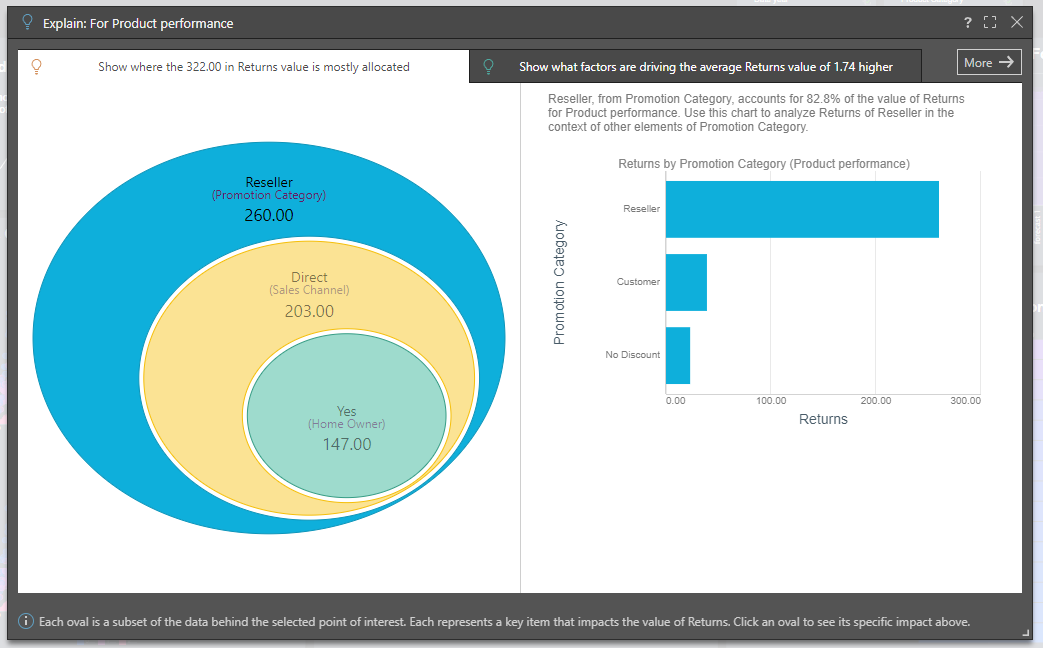
The lower right panel is scrollable, so by bringing up the lower part of the Data, it gives you Product Returns by Quantity & Reason a simple right click on any of the data points in the Product Return List, offers you Explain.

This additional information show you AI generated further insights the data.
But the real superstar of this dashboard is hidden right in the middle.
Hidden Gem in the Dashboard

If you click on the bottom of the center Report you can see two words. Results and Form Submission. If you click on form submission, the panel changes and gives you access to a Google Form that would allow you to feed back any information like, a store report, order numbers or comments right from the Analysis dashboard. Storing this information with the Store Report in the database can increase store productivity hugely.
Learn More
Learn more about Reporting and Dashboarding in our Learning Live Sessions about Present
Dive deep into this topic with Training in the Learning Hub: https://learn.pyramidanalytics.com/