
0
Multilevel Sankey
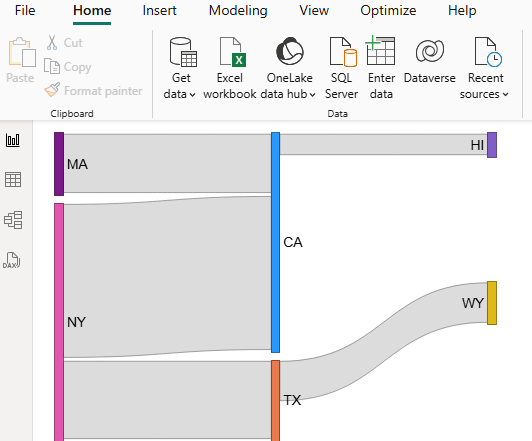
Is there a way to create a multilevel sankey diagram? For example, if I have a dataset like this:
| Source | Target | Values |
| NY | TX | 100 |
| NY | CA | 200 |
| MA | CA | 75 |
| CA | HI | 25 |
| TX | WY | 50 |
I'd like to produce
1 reply
-
Hi
Unfortunately, no. You can do multi level Sankey charts by creating multiple Sankey charts where the target of one becomes the source for the next, then positioning them side by side (with a small overlap) in Present and group them together. However, each Sankey chart's width of connector is determined by its relationship to the total for that individual Sankey, so the scale is different between them, so in your example, the connection between CA and HI and TX and WY fills the whole chart, losing the relative size between the two charts.
In this scenario, maybe creating a custom visual is the answer.
Hope that helps.
Ian