0

Use the same Scale on Y axis and Secondary axis

How can I use the same scale in a chart?
 

12 replies

null
    • Redeemed from the Dark Side (Power BI)
    • Obee1
    • 1 mth ago
    • Reported - view

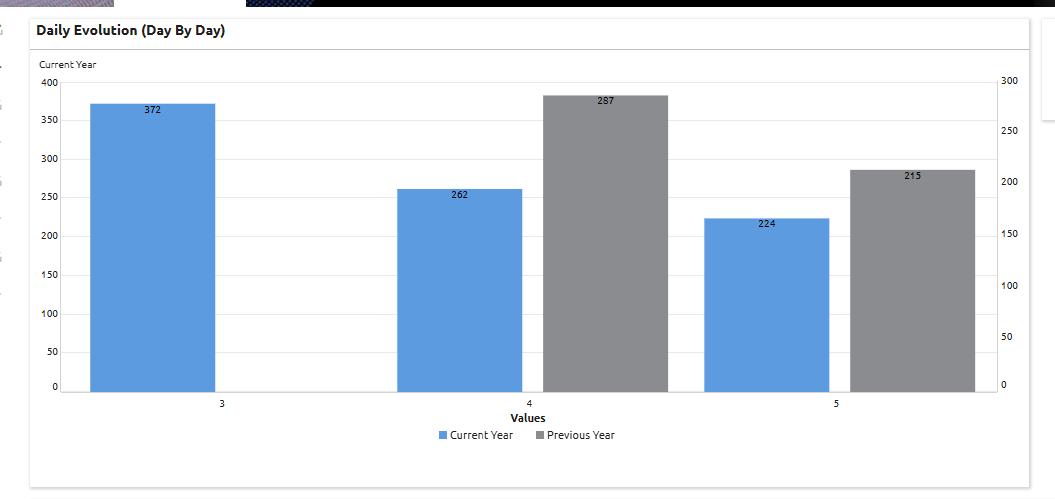
    The point of a secondary axis is that it has its own scale. If you don't want a different scale, put both measures on the primary axis. 

      • Pedro.1
      • 1 mth ago
      • Reported - view

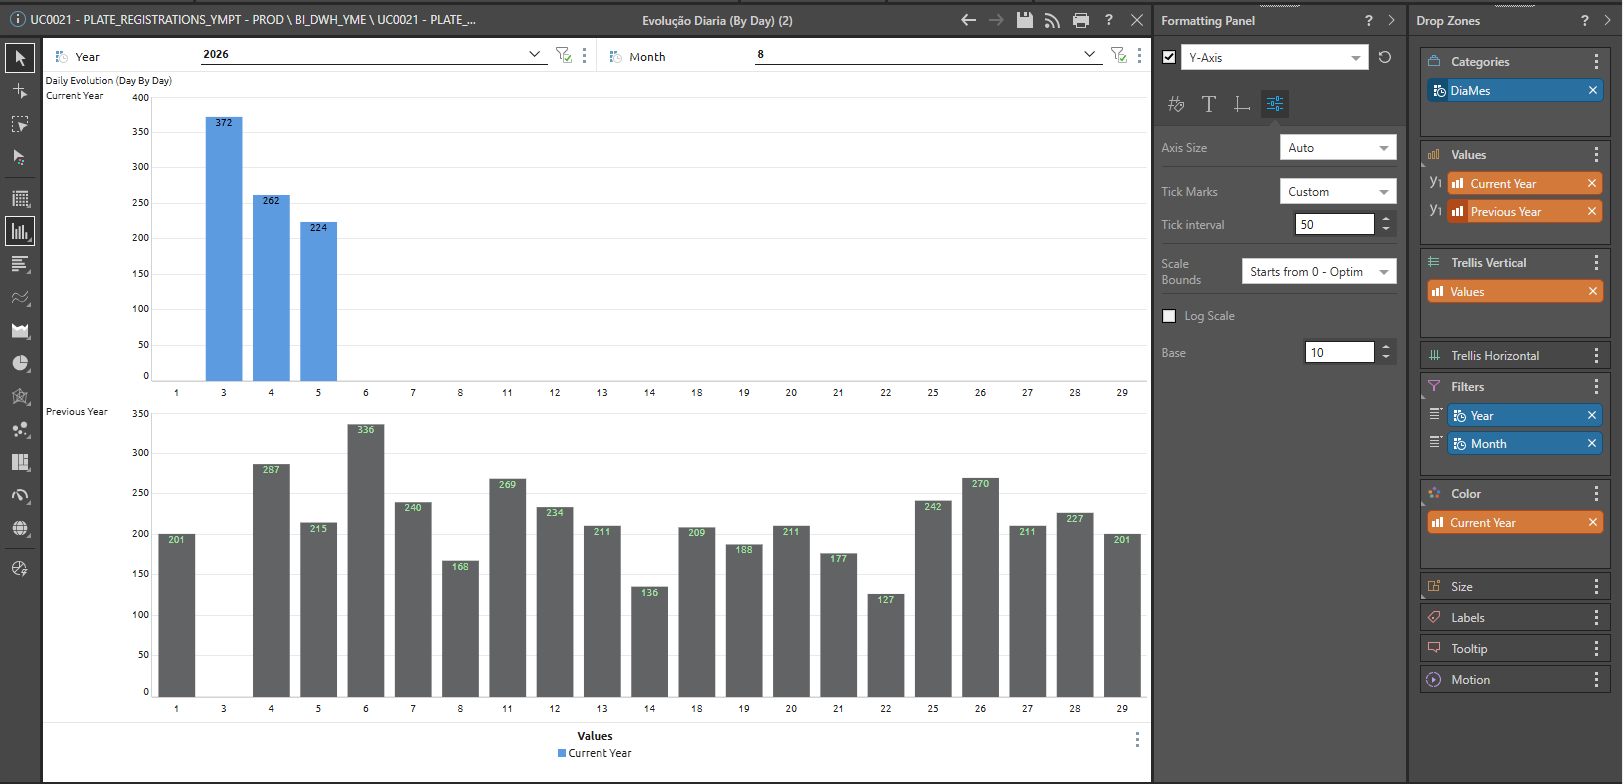
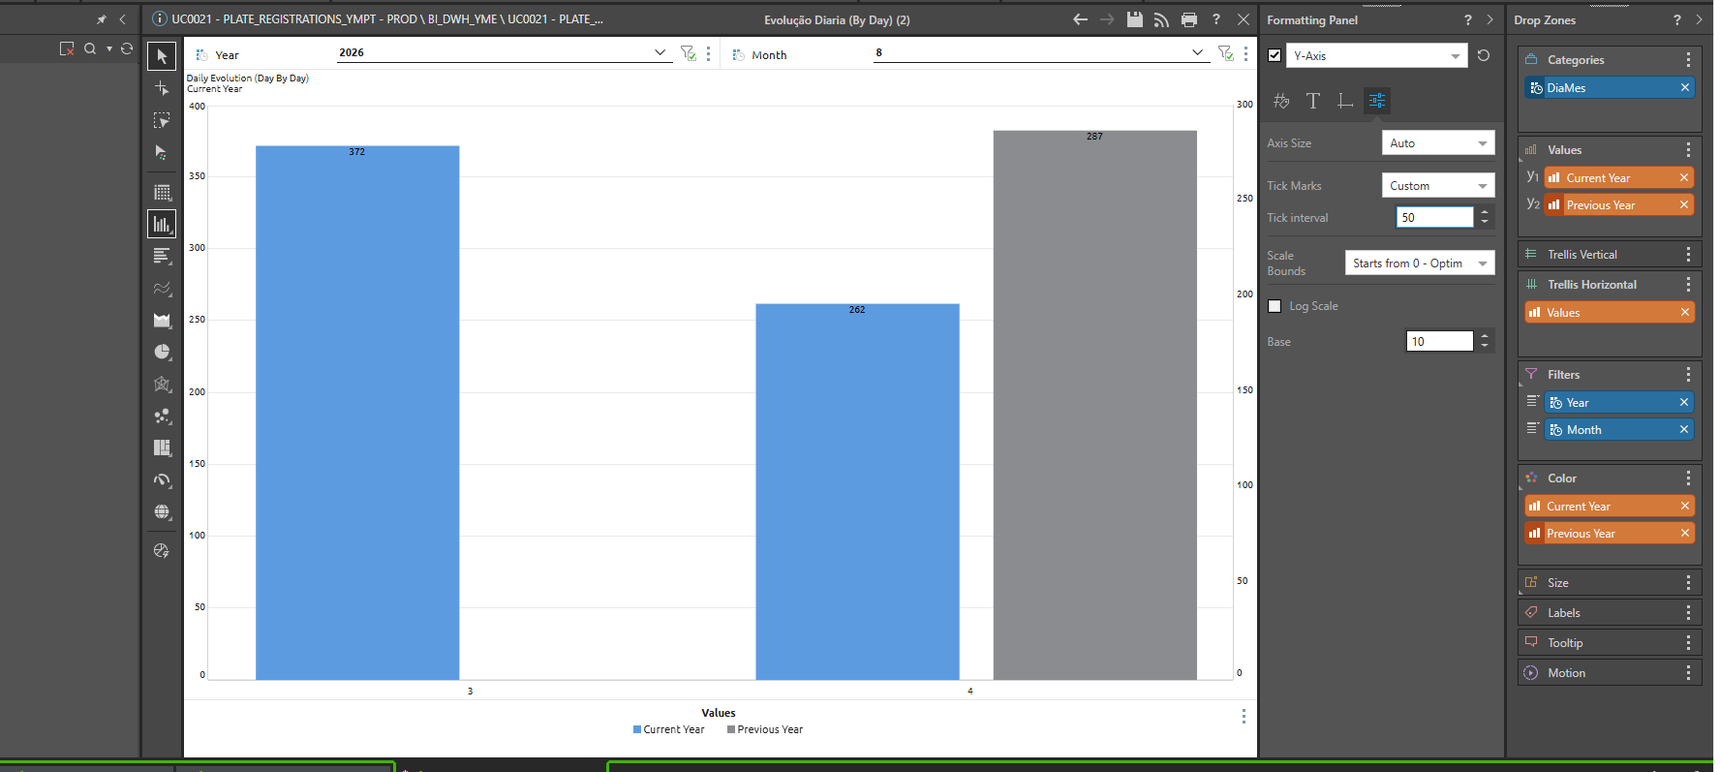
       If i do that creates 2 charts in the same chart :-( 


      • Lead Consultant Advanced Analytics
      • Michael_Daun
      • 1 mth ago
      • Reported - view

      , to fix this:

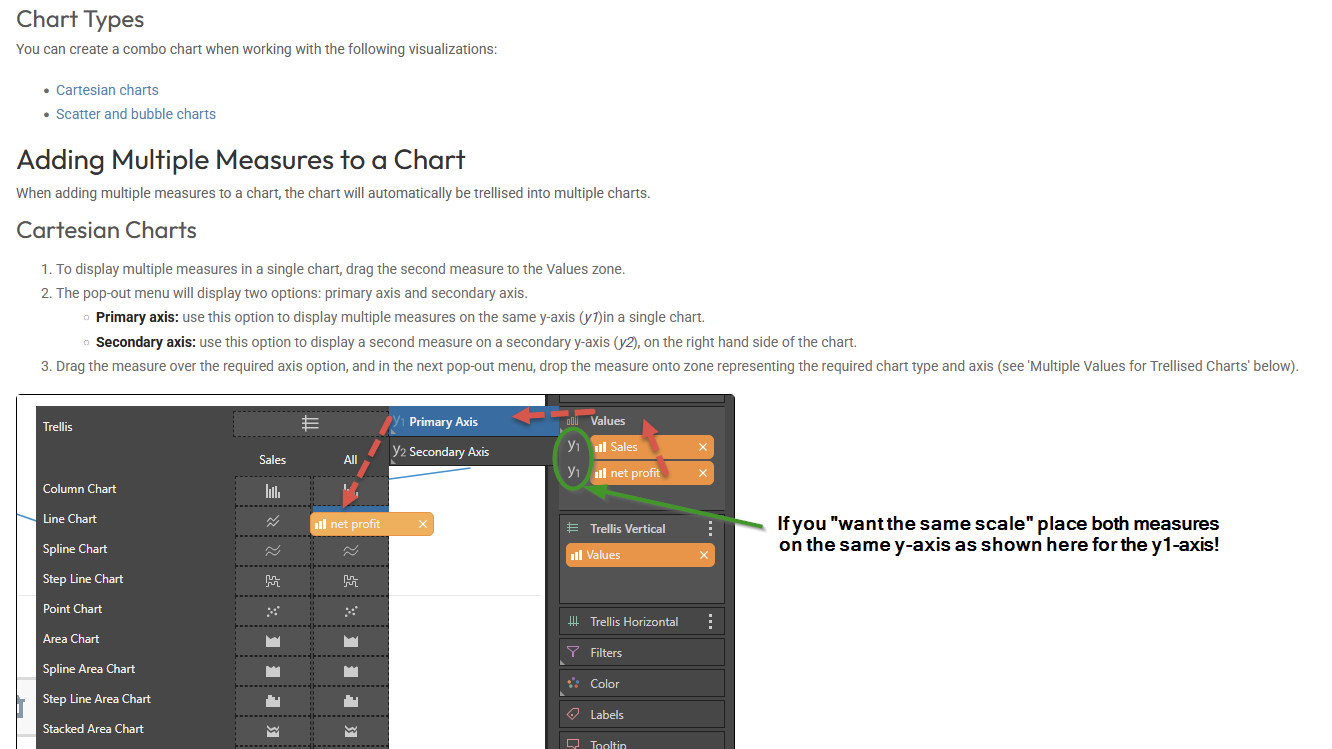
      1. Delete the "Values" chip from the "Trellis" dropzone. As an effect one of your two measure chips in the "Values" drop zone will disappear.
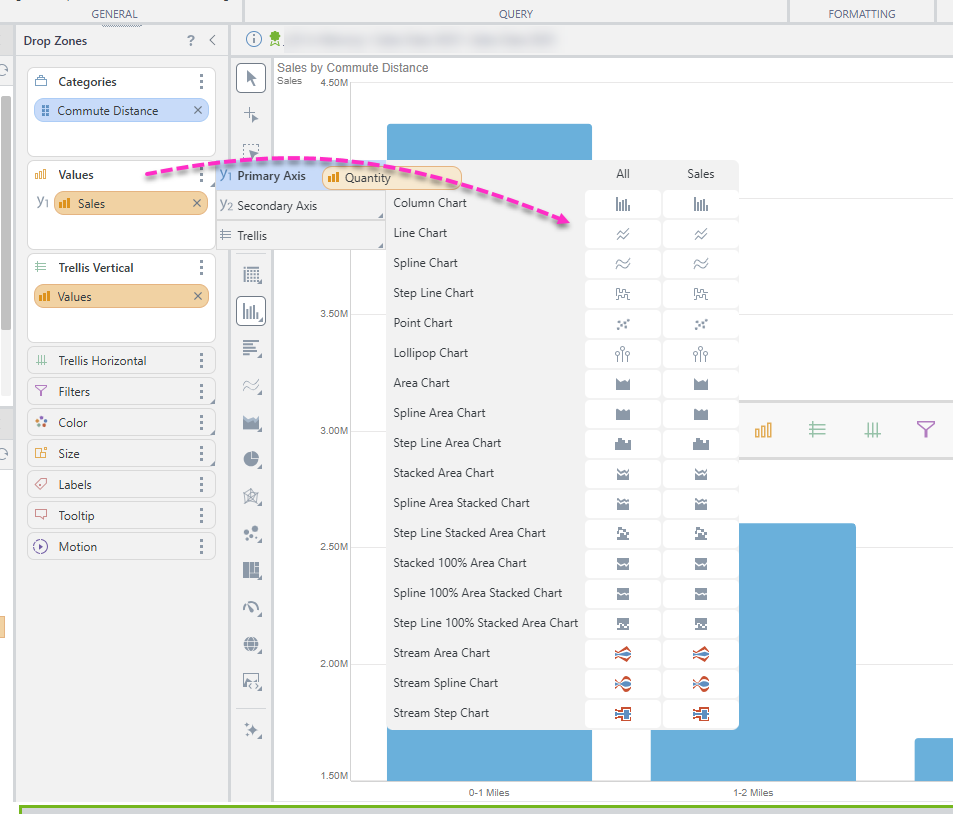
      2. Drag the measure chip which just disappeared, move it to the three points right of the "Values" drop zone and choose "Primary axis" in the pop up. 

      Hope this helps!
      Micha

      • Pedro.1
      • 1 mth ago
      • Reported - view

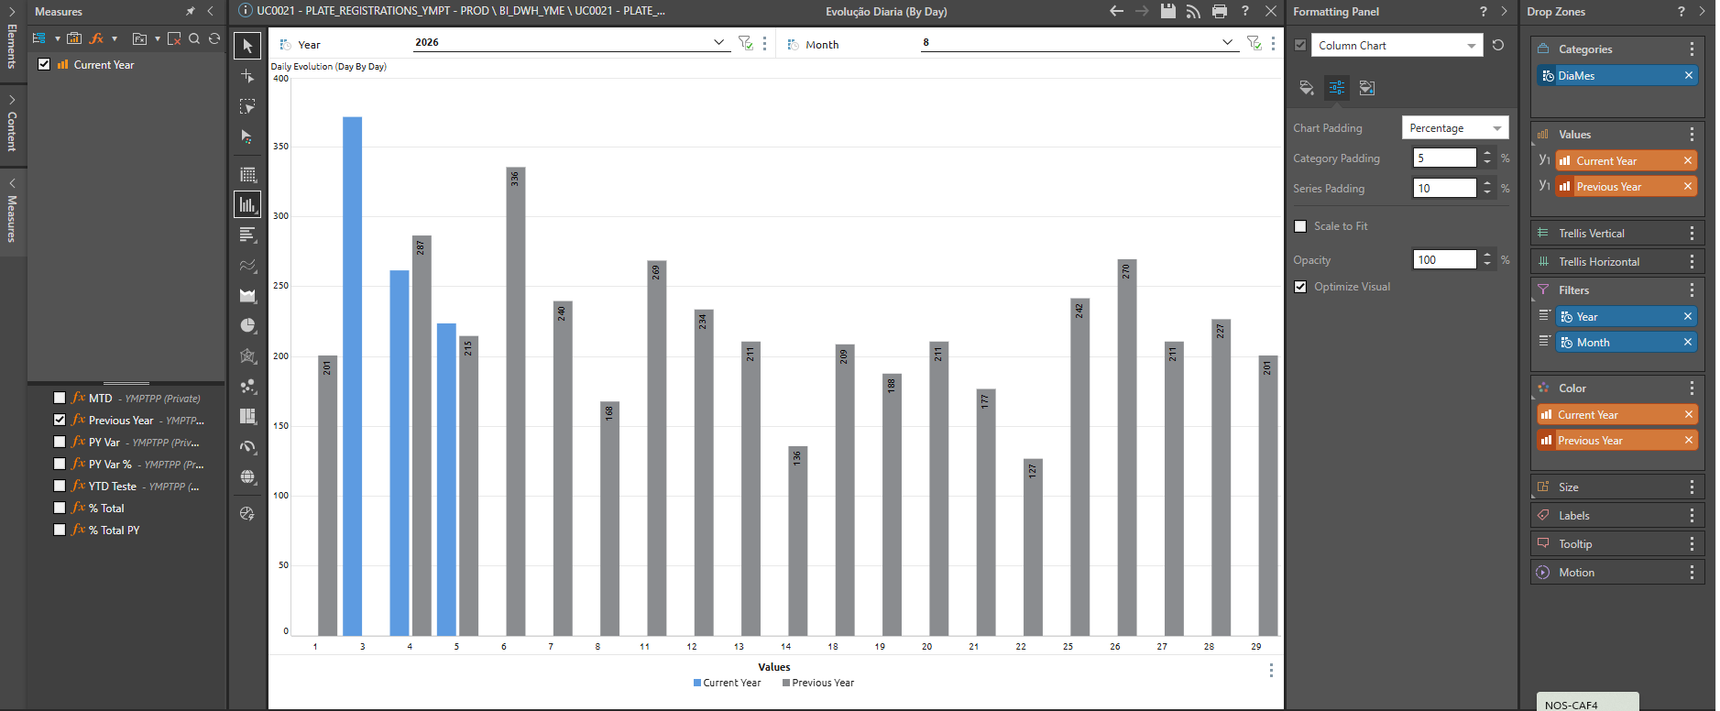
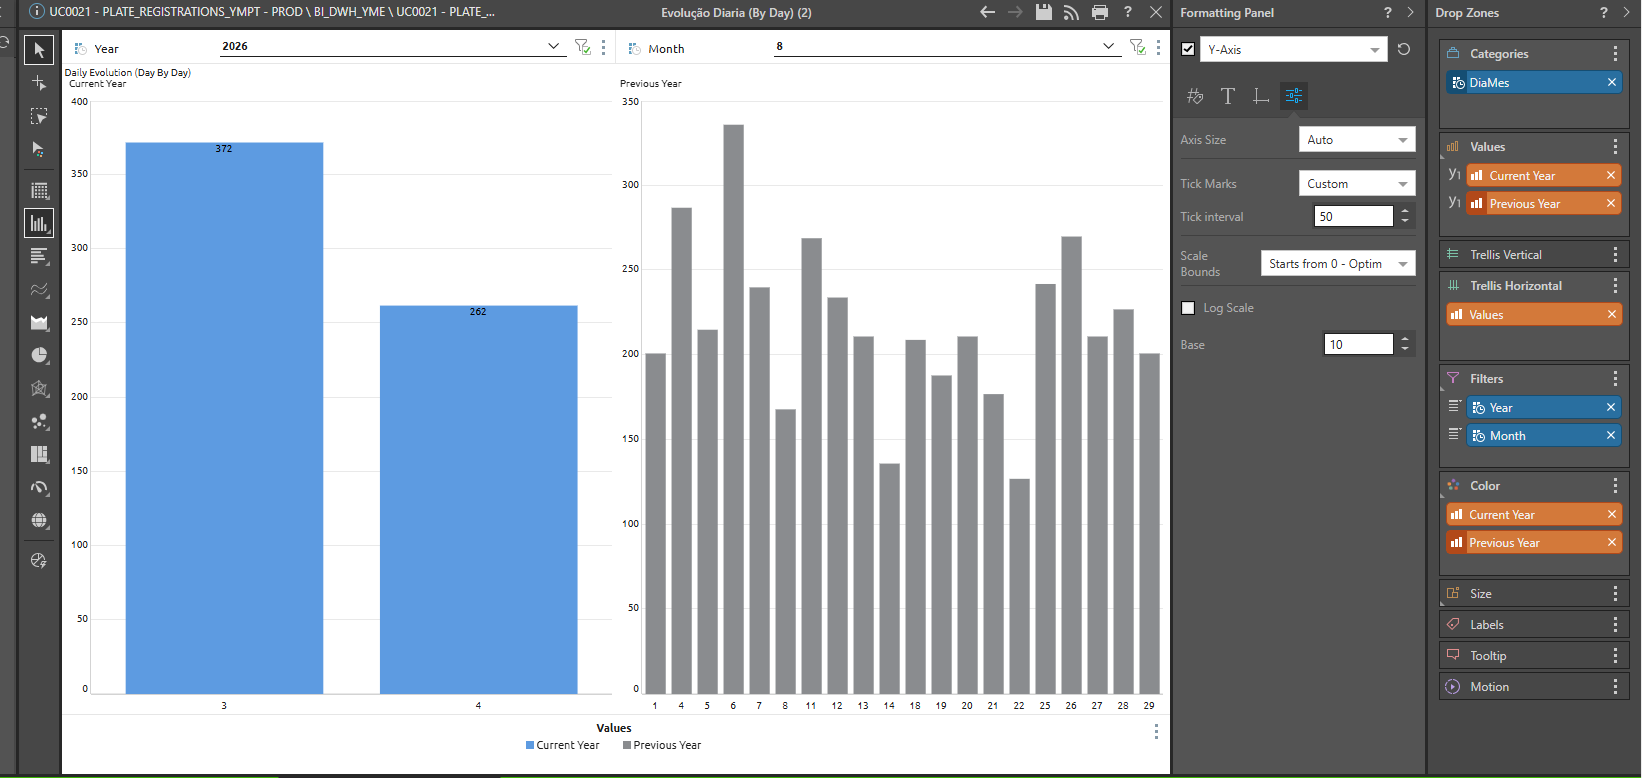
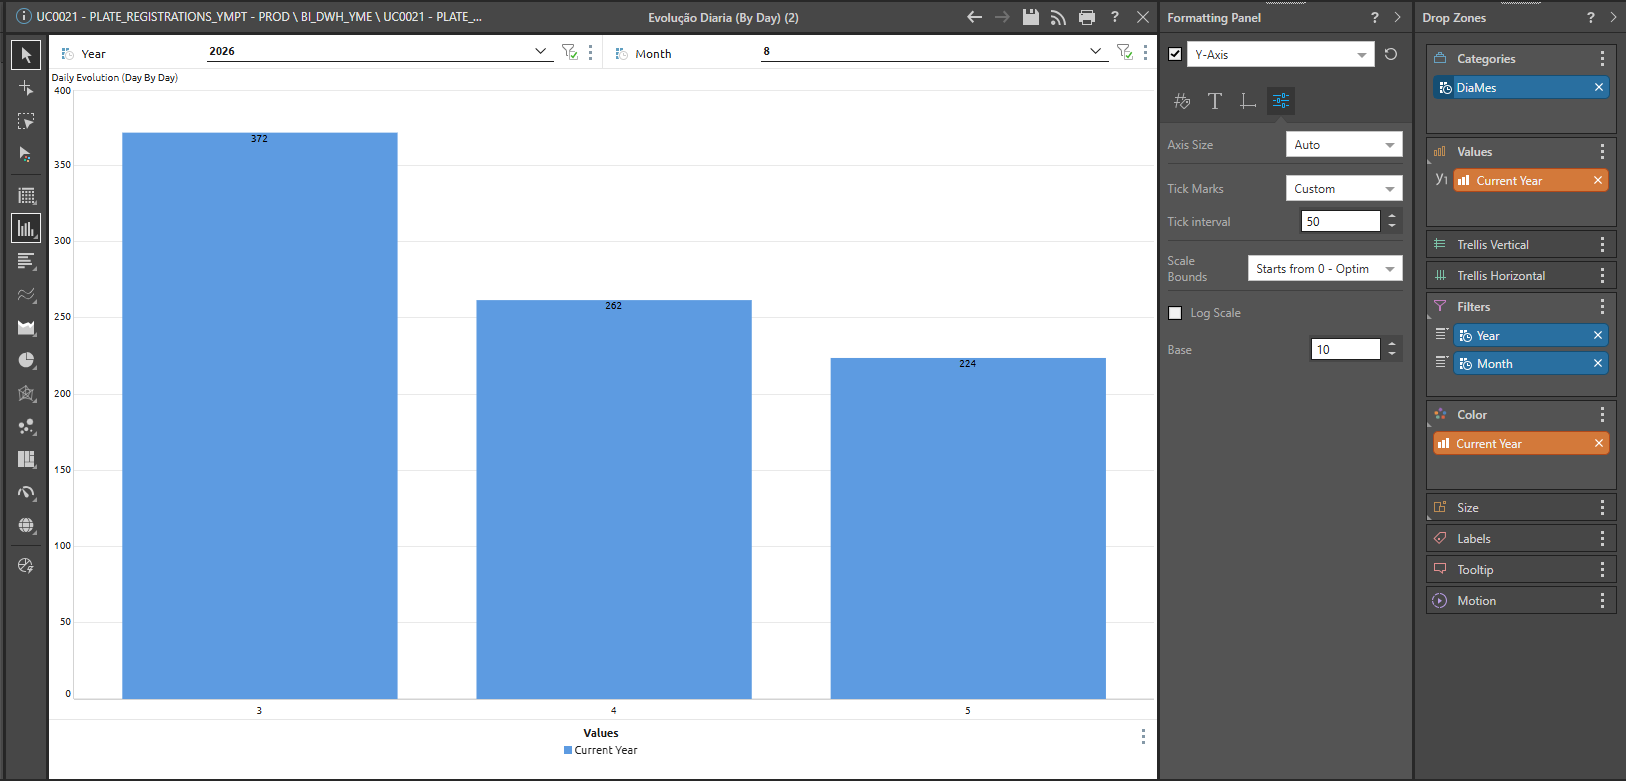
       after point 1 

       after point 2

       :-(

      • Redeemed from the Dark Side (Power BI)
      • Obee1
      • 1 mth ago
      • Reported - view


      • Pedro.1
      • 1 mth ago
      • Reported - view

       Done! :-)

      • Pedro.1
      • 1 mth ago
      • Reported - view

       its possible to show days with no data? 

    • Hillel_Dor.3
    • 1 mth ago
    • Reported - view

    Hi ,


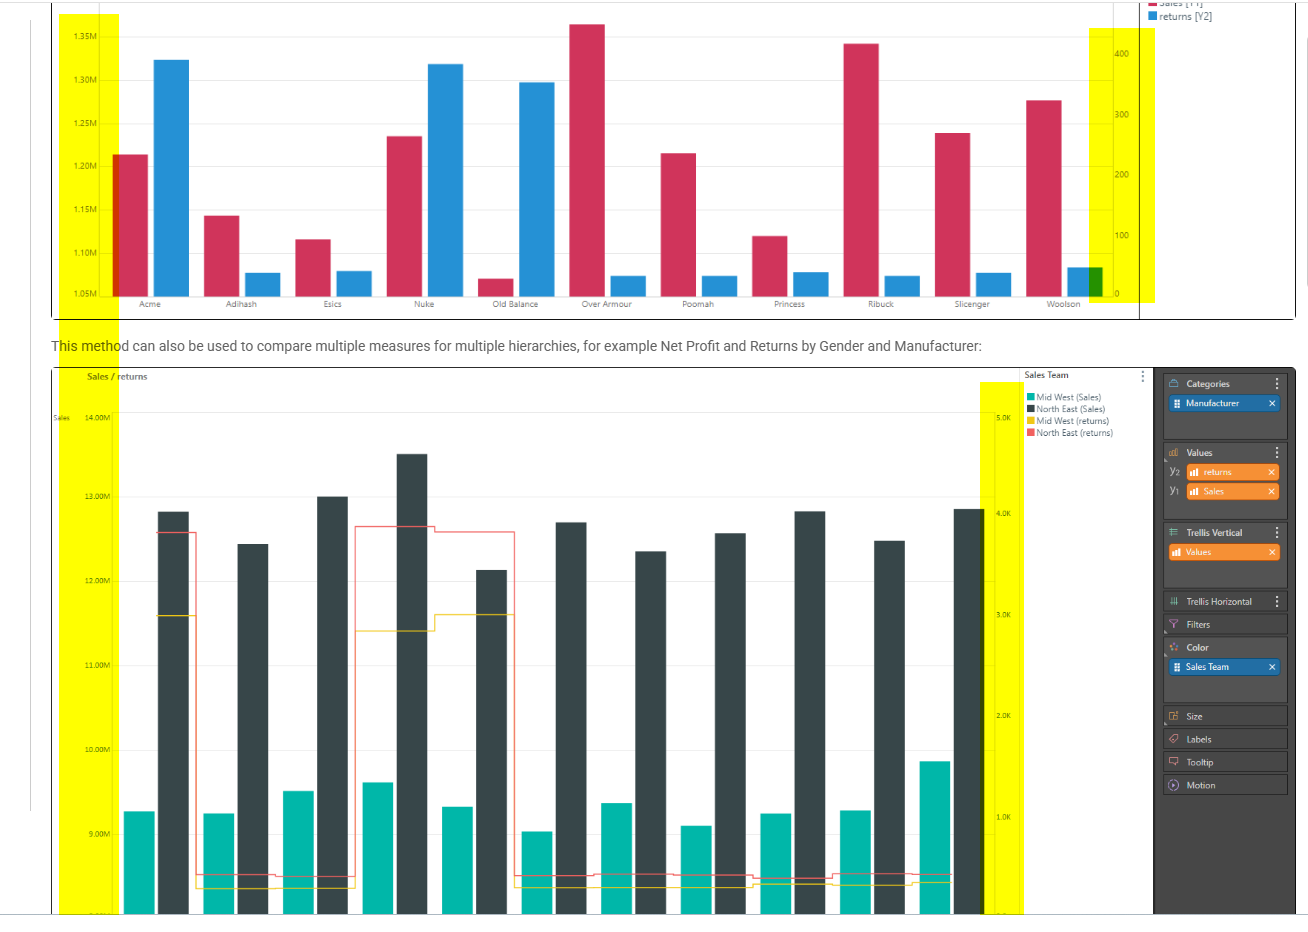
    Adding to the good answers you received from our members, I'll refer you to our Help page which explains how to use such Combo Charts.
      • Pedro.1
      • 1 mth ago
      • Reported - view

       The link you shared doesnt have the solution for my issue... i want the same scale 


      Thank you!!!

      • Lead Consultant Advanced Analytics
      • Michael_Daun
      • 1 mth ago
      • Reported - view

      , read on - just a little bit further... 😉

      • Lead Consultant Advanced Analytics
      • Michael_Daun
      • 1 mth ago
      • Reported - view

      Oops, I obviously was a little late, sorry!
      At first, I hadn't seen the posts from the meantime.🙈

      • Hillel_Dor.3
      • 1 mth ago
      • Reported - view

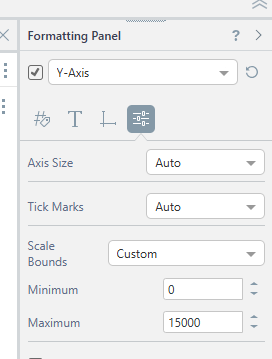
       The Y-axis scale is automatically set to be above the Max value of the measure/s on it. If you want both sides (Y1 & Y2) to have exact same scale range you can manually set it for both through the Formatting Panel

       https://help.pyramidanalytics.com/2025/Content/Root/MainClient/apps/Discover/PRO/Formatting%20and%20Design/FormattingPanel/Axes.htm?Highlight=scale%20bounds

Content aside

  • 1 mth agoLast active
  • 12Replies
  • 563Views
  • 4 Following