0
Create a column chart with 2 measures
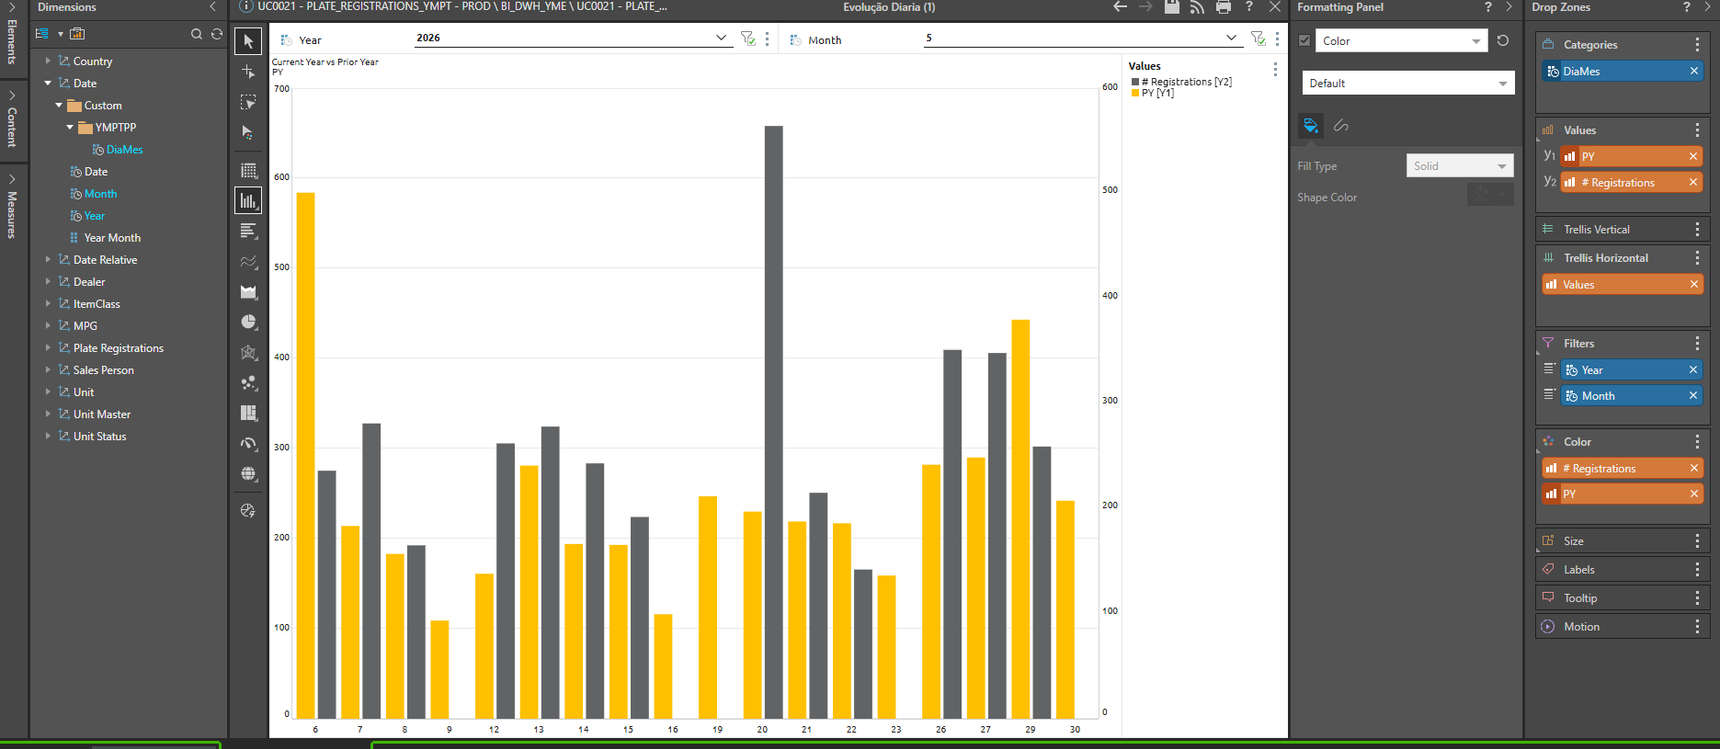
Its possible to create a column chart to show by day two measures? Current Value and PY value?
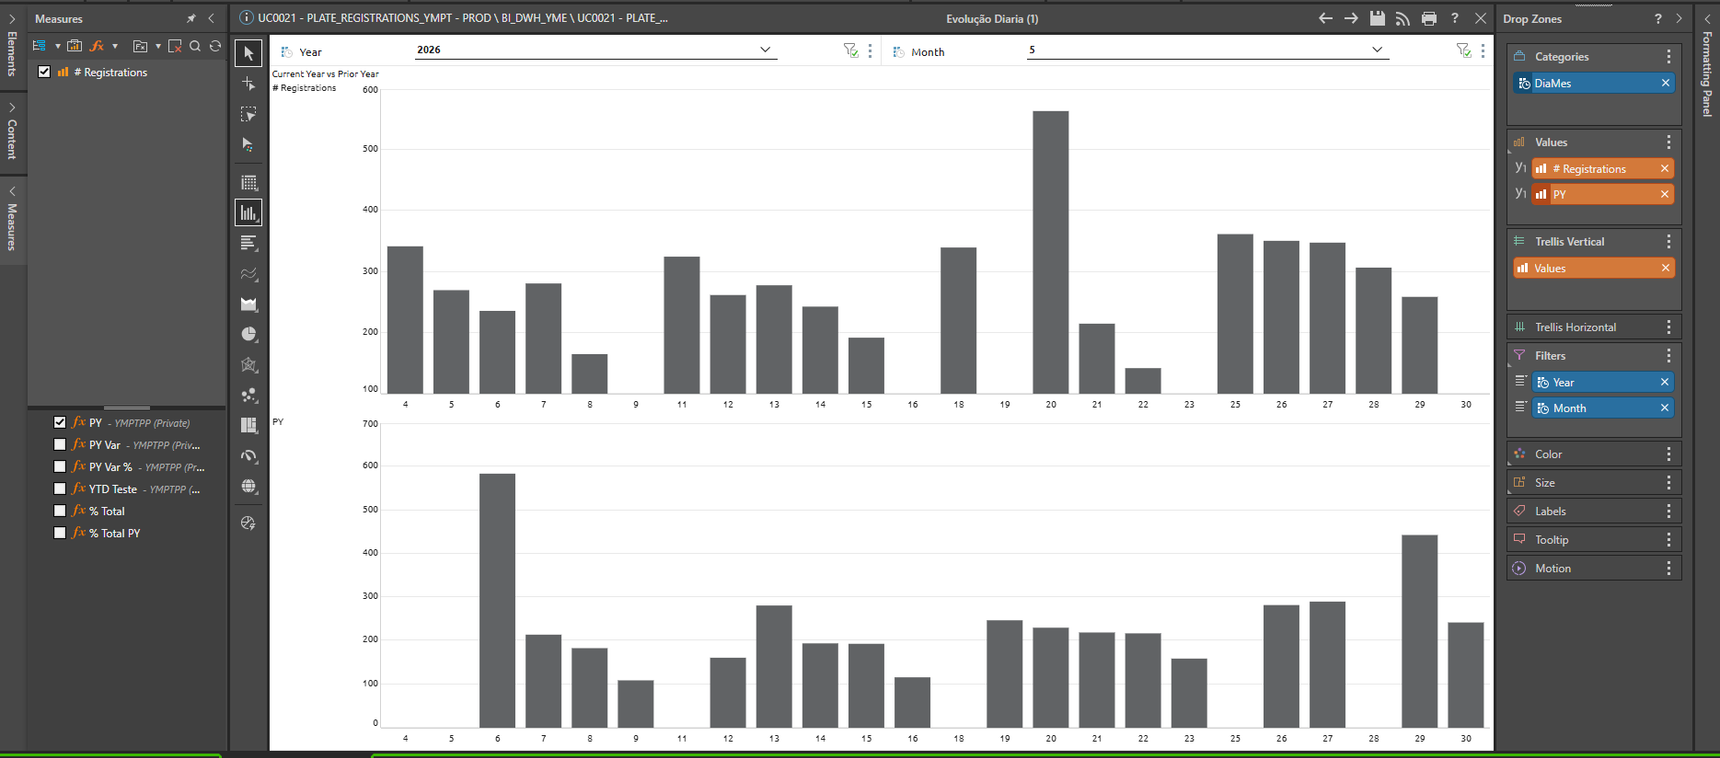
Im facing issues because it split the chart in 2!
2 replies
-
Hi
Grab one of the Measure chips and hover over the Value drop box heading.
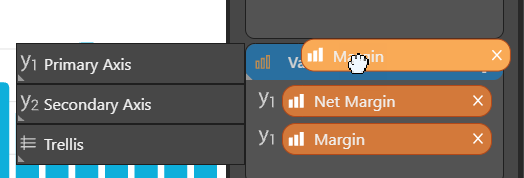
Then hover it over the Primary or Secondary or Trellis (default) subheading:
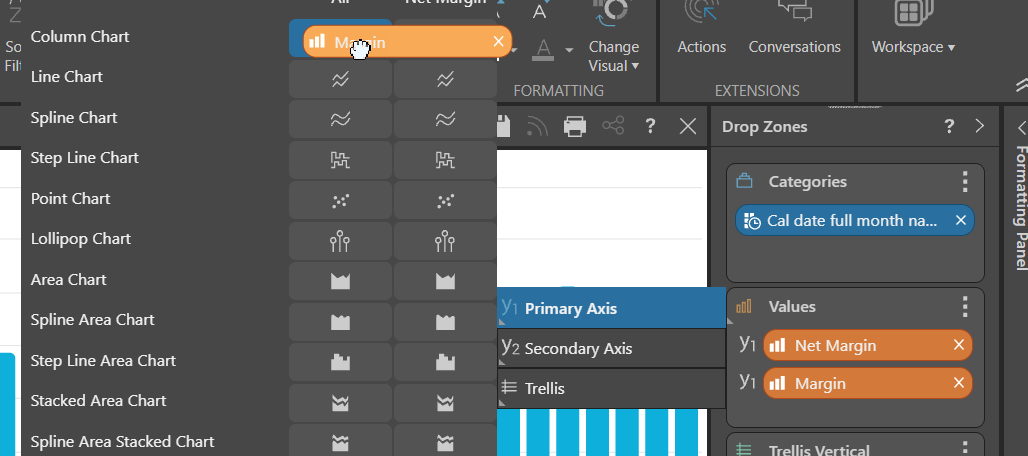
Then choose what chart type it should be and drop it on that option:
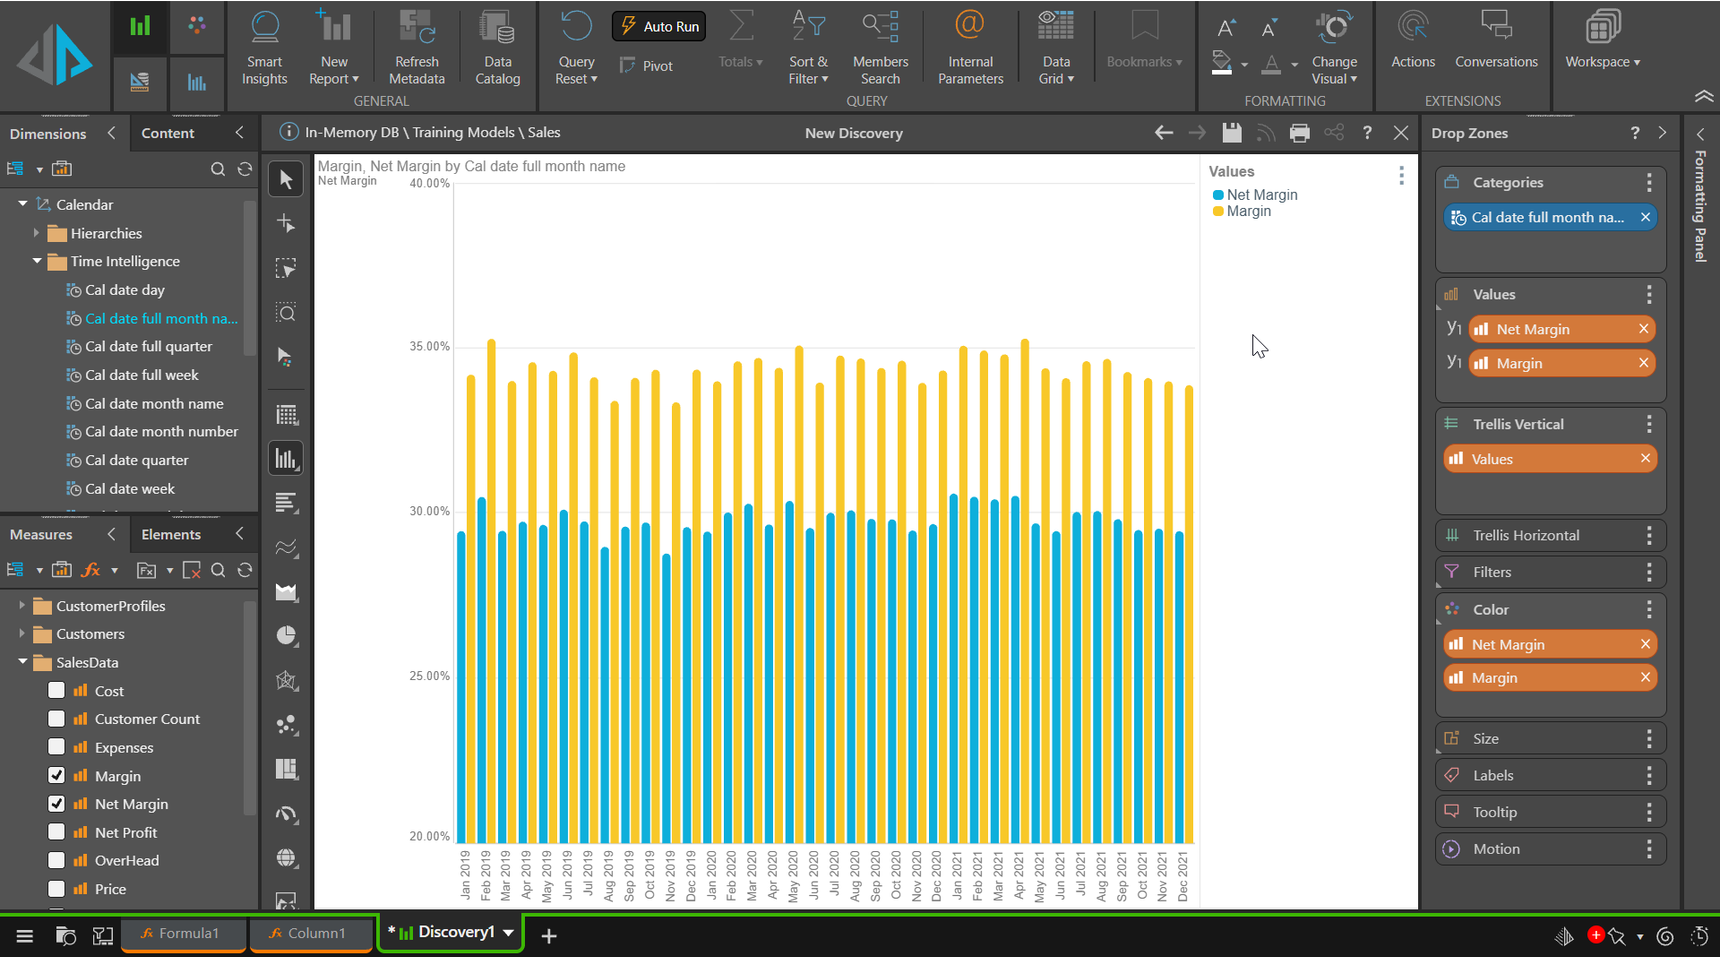
This way you can combine multiple chart types with multiple axes to get the chart you need.
Hope that helps.
Ian