
2
Pyramid Office Hours 4/16 - Setting Data Based Colors
In the Color options, is there a way to "hard code" which colors I want for which values? For example, I want everything > 5 to be red, everything <= 5 to be green, can we do that?
1 reply
-
You can set which colors are displayed for which values. How you do this depends on if you are using a measure or a dimension in the color drop zone.
If your color is based on a categorical variable:
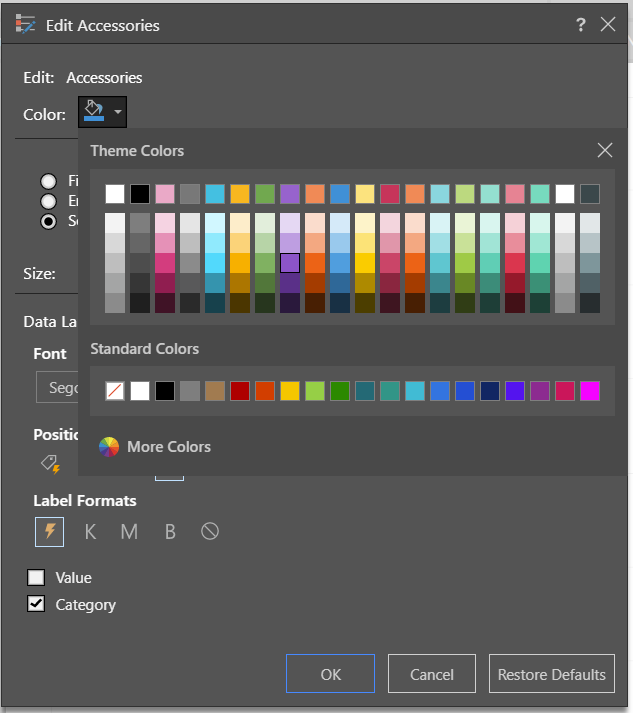
- Right click on each entry in the chart legend

- Select Edit "[Item]"
- Choose a color in the subsequent window
If you want to set colors based on defined ranges for a measure you can create a custom color measure
- Create a Custom Color Measure in the Formulate App
- Open the Formulate App for your model and select formula
- Create a conditional calculation as shown below to define what colors you want for each range. You have access to the full library of functions to define this logic

- Drag the the measure created above into the color drop zone. As you add this dimension to the drop zone make sure to select the custom color option
