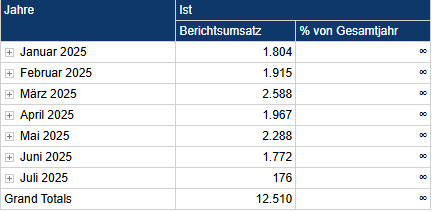
Monthly percentage of annual value

Hello,
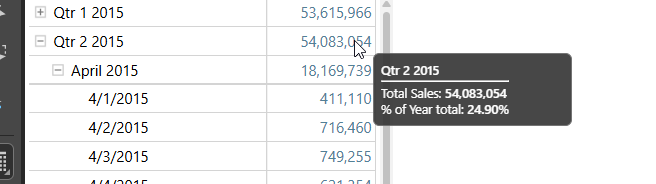
I have created a line chart showing the monthly distribution of reported sales. I tried to add a tip tool that shows the percentage of the month's value relative to the annual value.
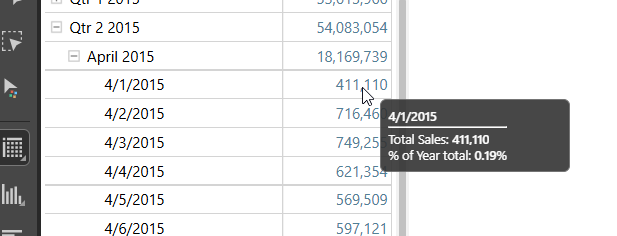
To do this, I divide the data point with periods - current member by periods - parent. It then calculates a percentage value for me, but I end up with a total of 400% because our data model also includes quarters, so it divides the monthly value by the total value for the quarter. Can anyone help me set the formula correctly?
Thank you
7 replies
-
, I do not know if my solution will work with your data source, but for me it looks like a classical contextual calculation.
So, I created a simmilar grid as yours...
...and then via right-click choose "Create measure" ... "Percent of Total"

...et voilà:

Hope this helps!
Micha -
, I forgot one thing: Once you have created this key figure as shown above, a new Business Logic element will be available below your measures - you may need to activate the corresponding view by clicking on the Fx button.

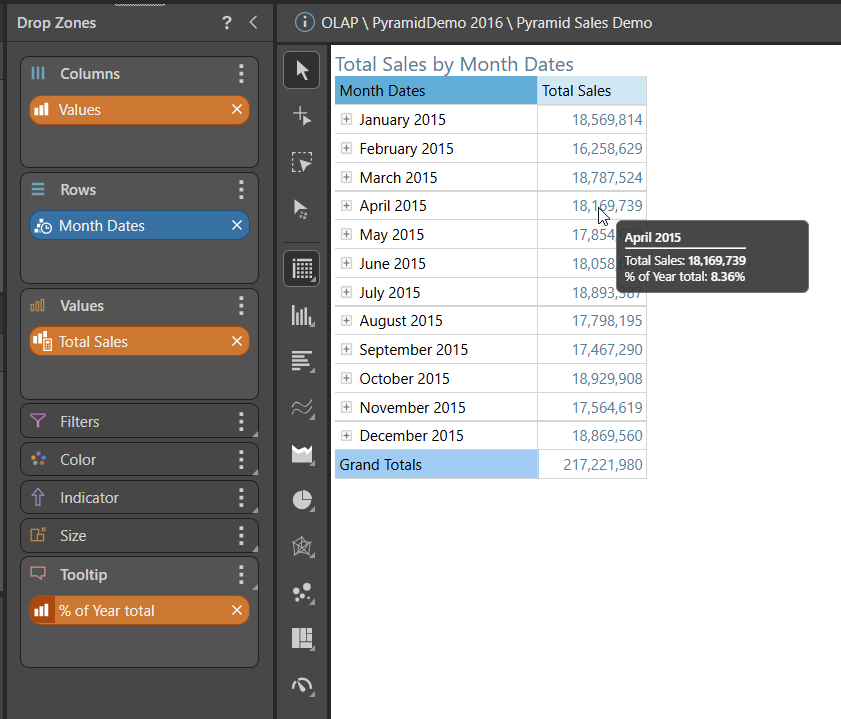
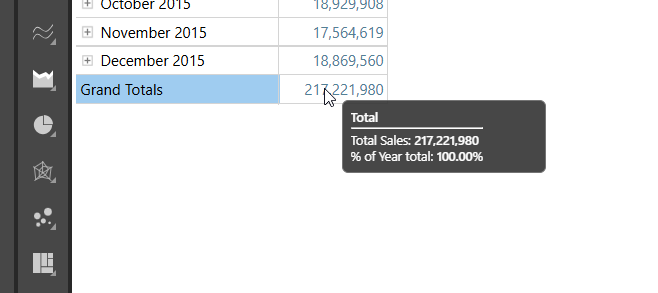
This element will automatically be placed in your Values drop zone which would give you a second column with %Total Sales (cf. the last screenshot from my first answer
 ). When you move or copy it to the Tooltip drop zone the percentage will be shown when hovering over the Sales value which was your actual requirement!
 -
Hello
Thank you for your reply. However, when I right-click, only the options “math functions” and “hierarchical functions” appear. Will the option “cumulative functions” only appear after updating to the latest version, or do I need to change something on my end?

Thank you!
-
Hi
I'm not sure why the context (visual) calcs are not showing up as expected, maybe your profle has then turned off.
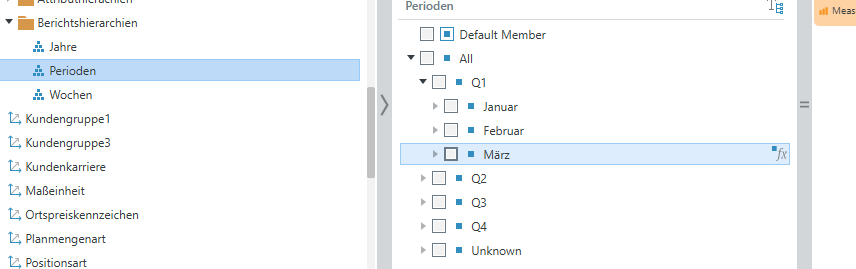
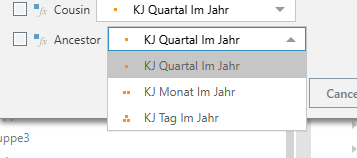
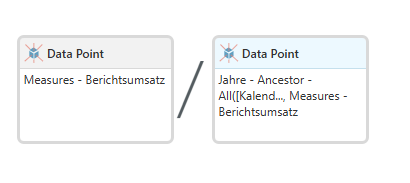
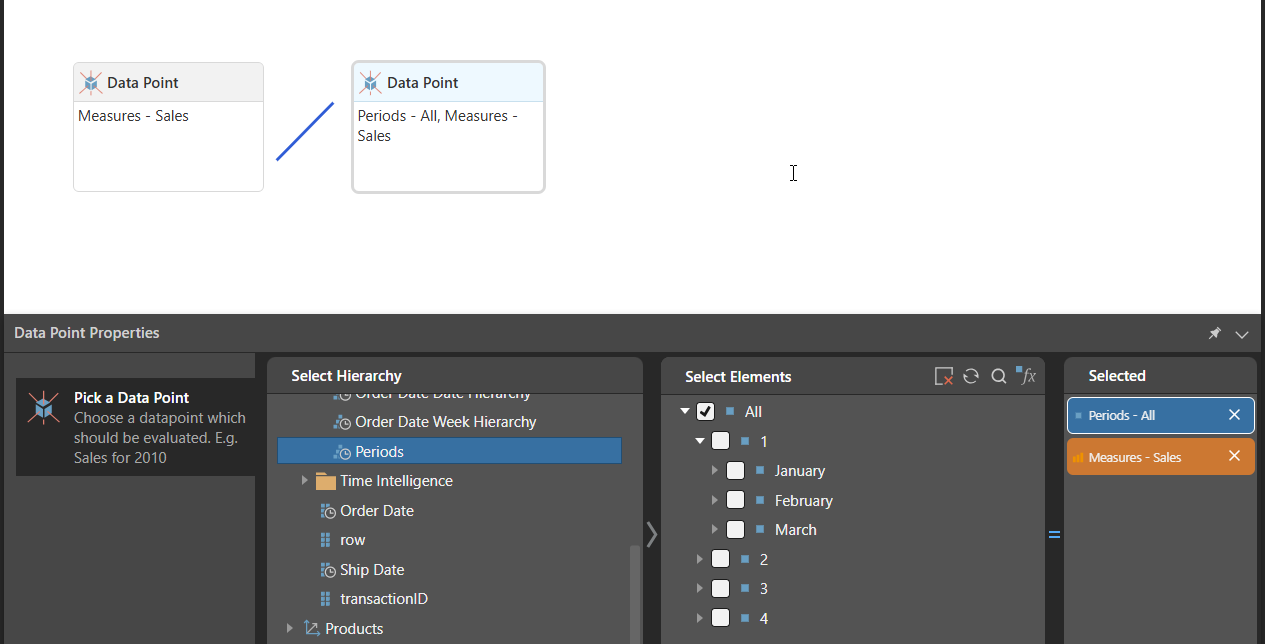
Anyway, you can chieve what you need by selected the "Ancestor" option in the functional selections for the divisor data point instead of "Parent" and choose the Year level:
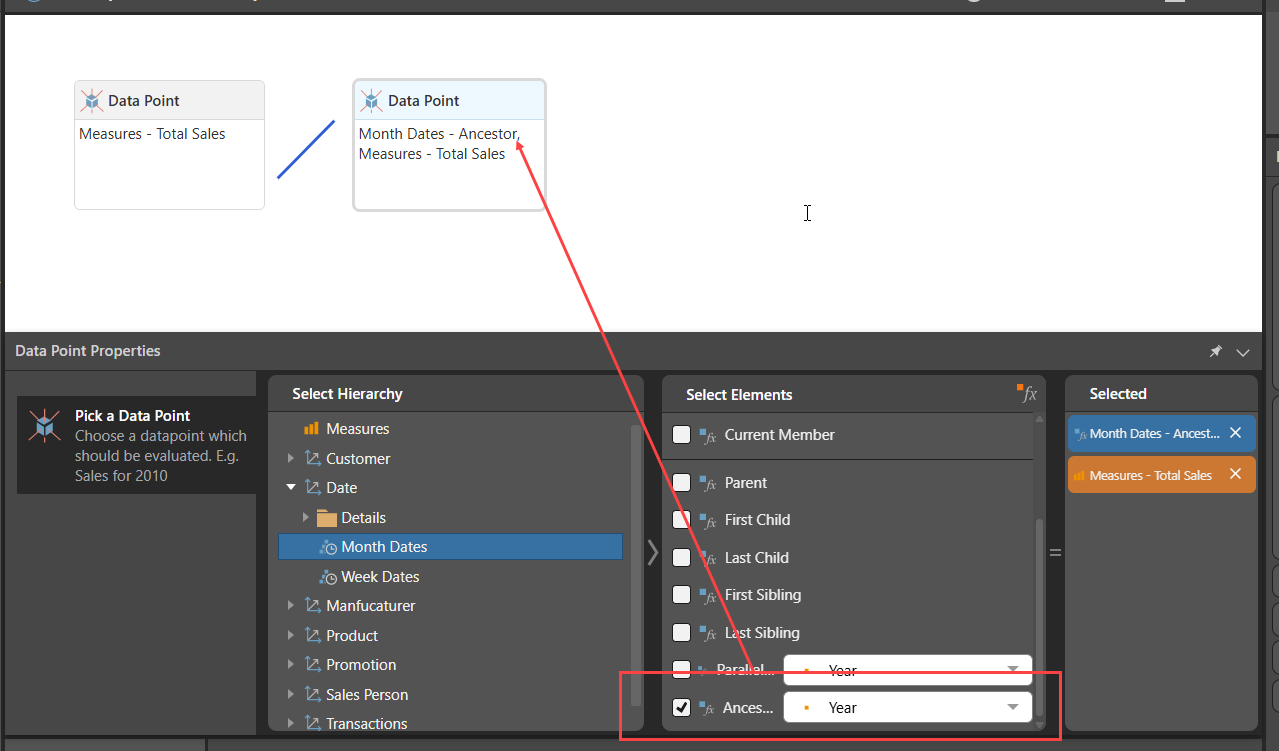
Then put that calculation into the ToolTip Drop Zone:
Note, this will also work at any level in the hierarchy, like Quarters and Days.
Hope that helps.
Ian
-
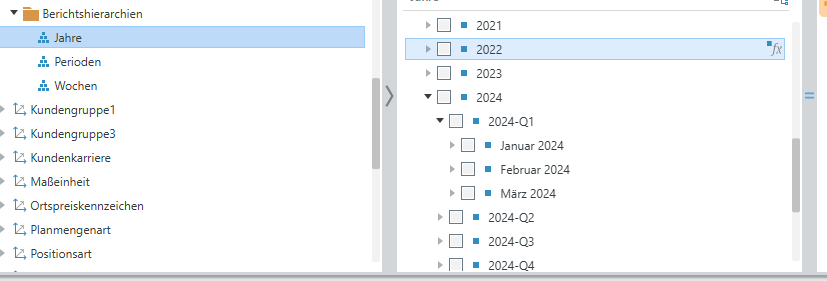
OK, I've created a periods dimension of Quarter number, Month and Day number.
Build a % Total Measure that is Sales / Sales for all four quarters. Then add Year as a filter in your Chart to show the sales and % of year for each month in the tooltip. Note: you need to turn on Data Points on a line hart for the ToolTip Measures to show up.
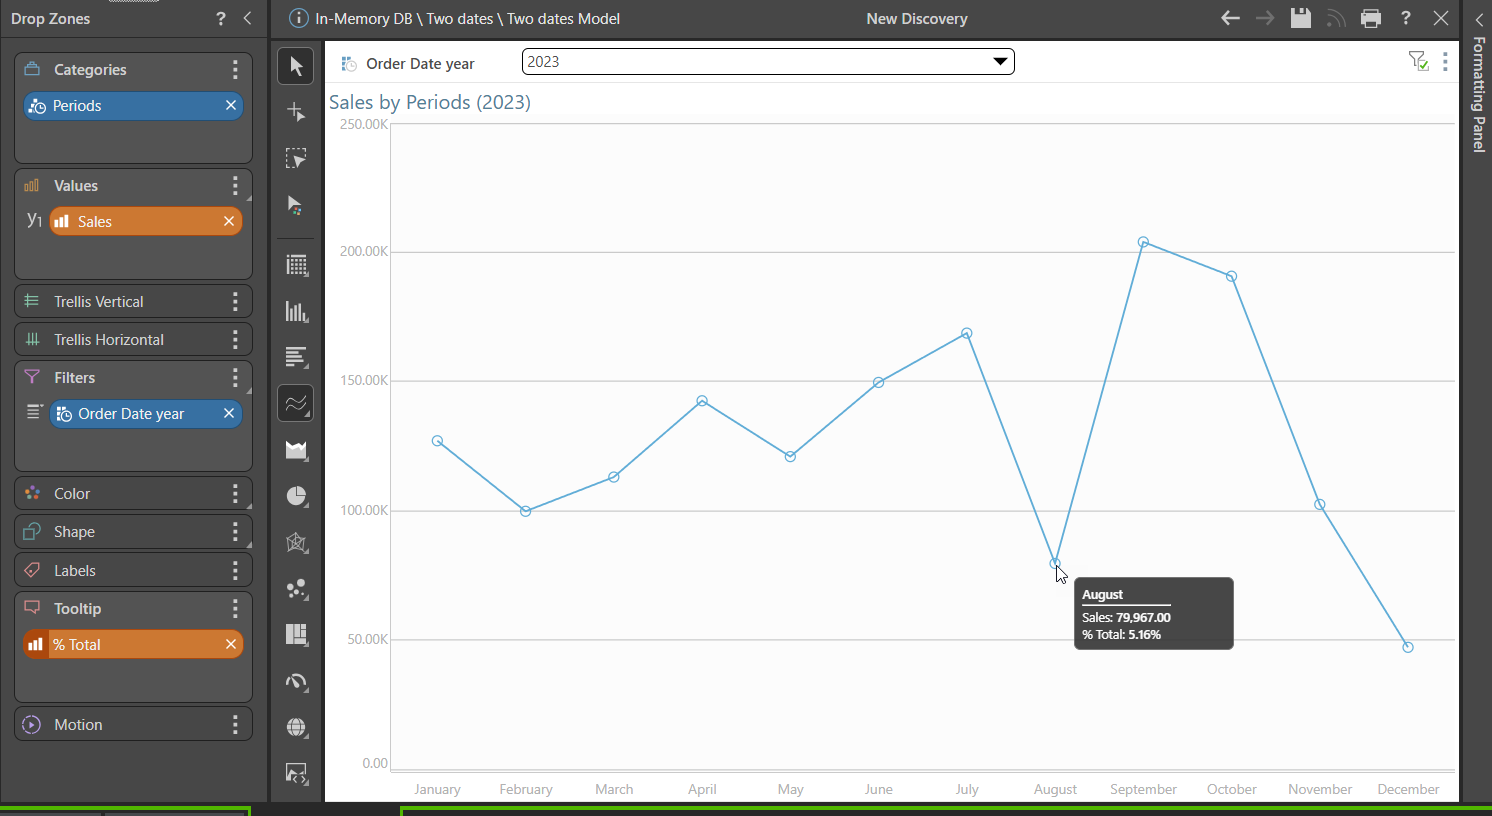
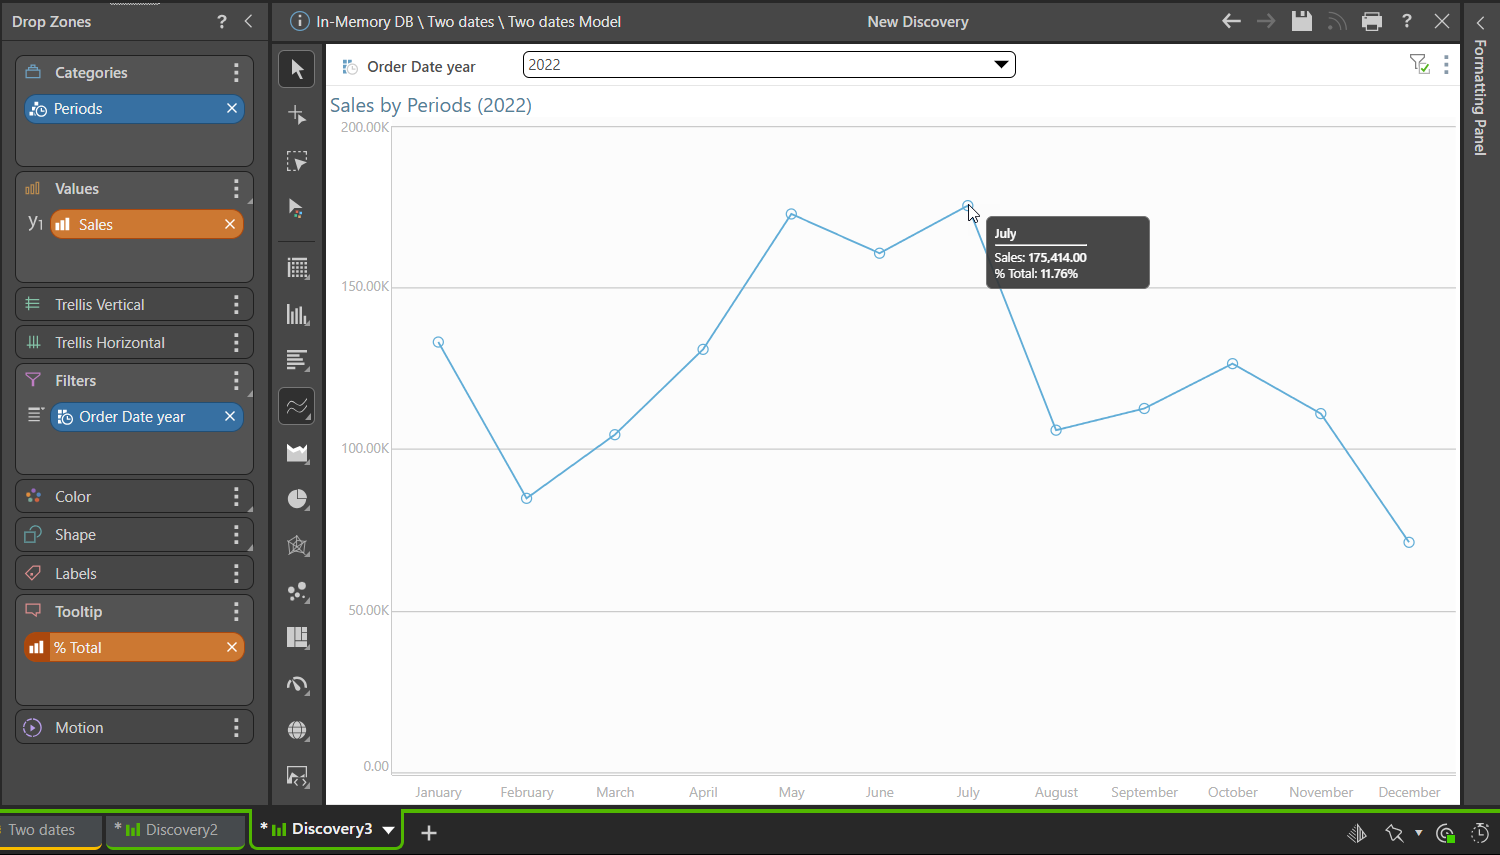
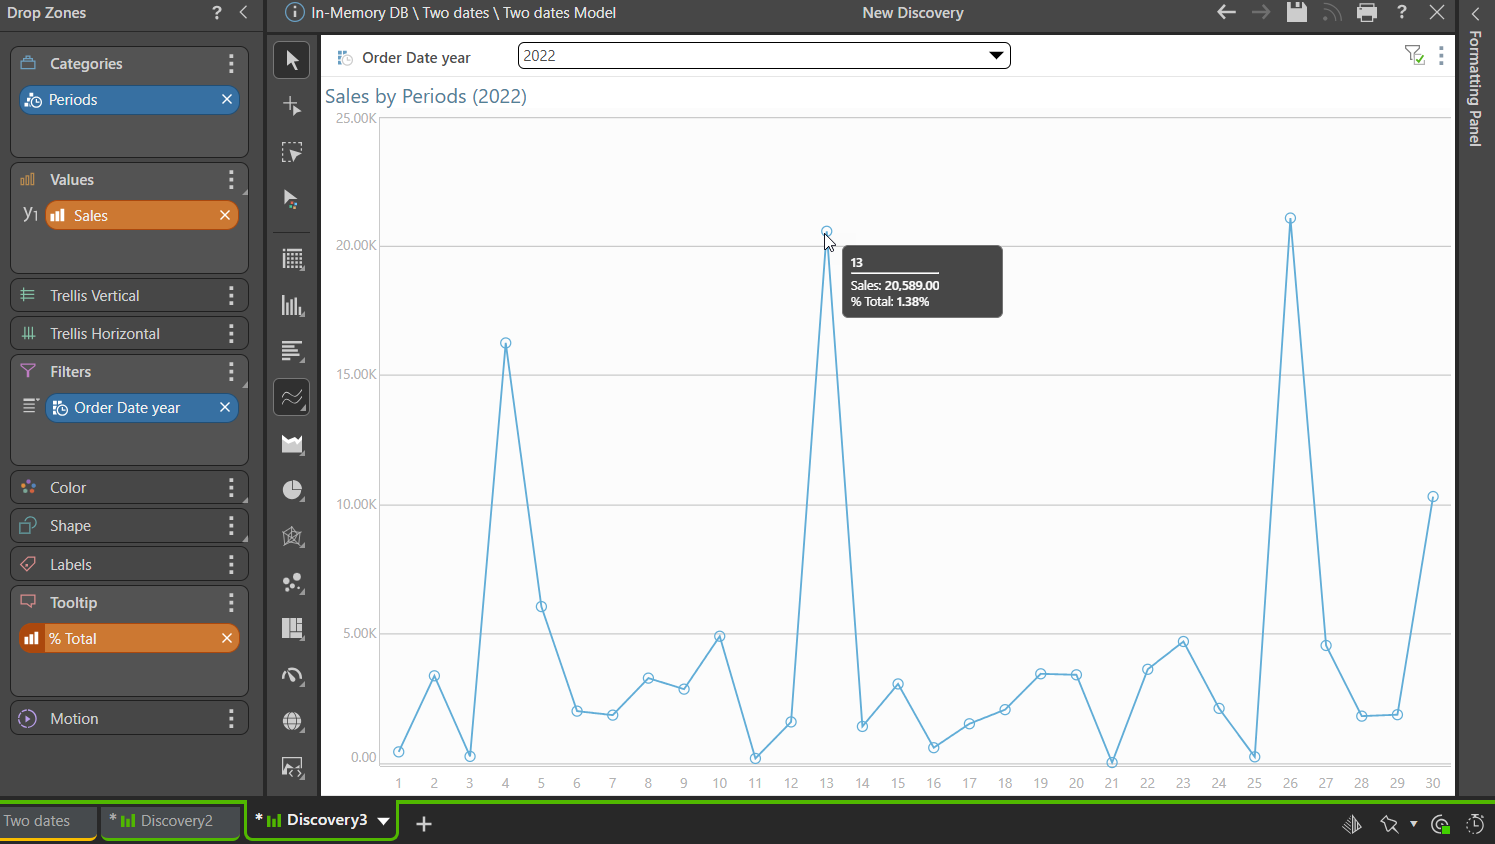
This will work at the Quarter, Month and Day levels as you drill up and down the Periods hierarchy.
Hope that helps.
Ian