
0
Showing Forecasting Confidence Intervals in Crosstab
Hi everyone,
I'm using the forecast feature in Discover. It shows a line chart, and for the forecasted periods it displays confidence intervals. Is there a way to show those confidence interval values in a crosstab, the way they appear in other charts?
1 reply
-
Hi
You can show the raw data returned from the forecast, including the confidence limit values, using the data grid, but in matrix grid mode, the confidence values are not shown in the main grid visualisation and are not accessible via formulate.
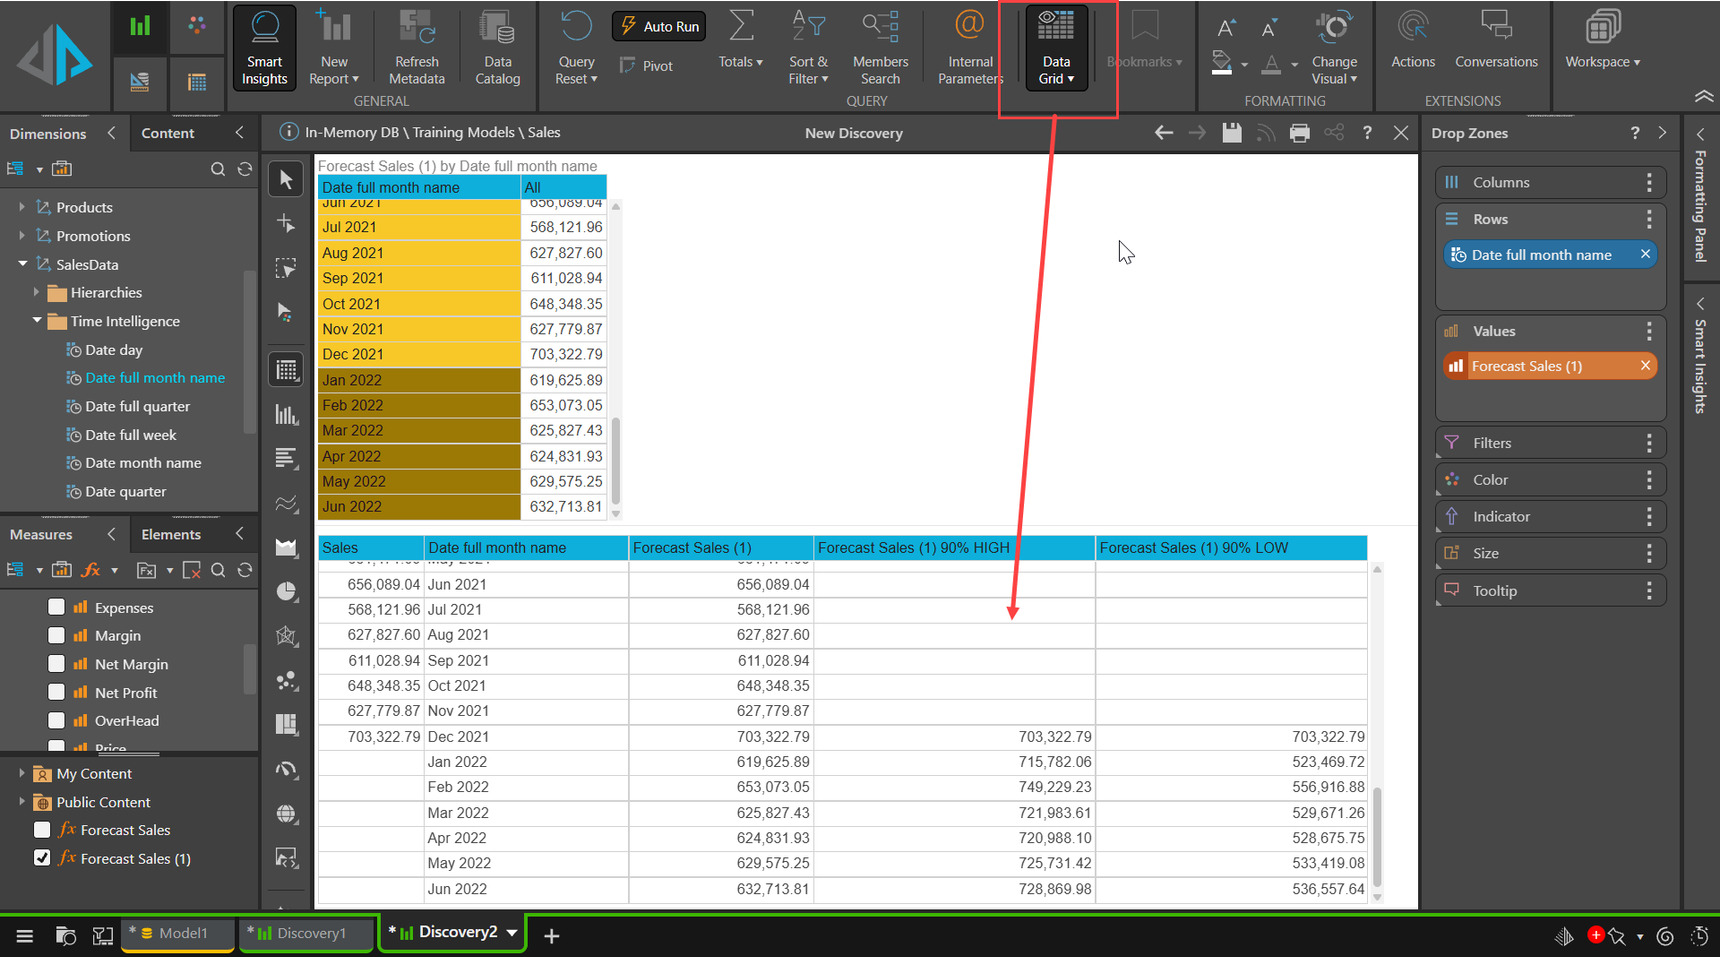
Hope that helps.
Ian