
Switch dimensions in a bar/column chart
Hello,
Is there any way we could switch between two dimensions in the categories of a bar/column chart? For example, right now we have a visualization prepared to show Financials by Accounting Year, but would like to switch back and forth between Accounting Year and Loss Year, two different dimensions. So I was wondering if there was a way that we could create a parameter to make it more flexible and switch between the two. We would just like to save some room on the dashboard instead of showing both, we can show one column chart and switch between the two categories.
Thanks in advance,
Sam
2 replies
-
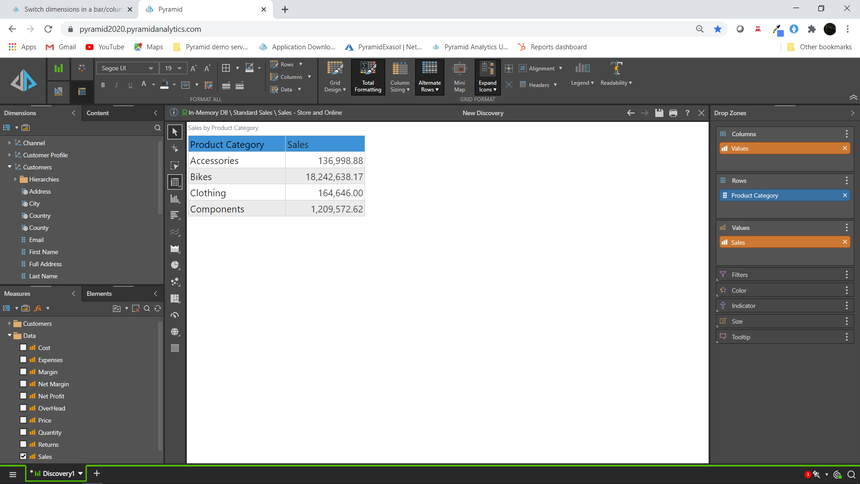
Hi Sam,
We included in Pyramid 2020.10 additional options, Swap and Add in the right-click menu when working with analytic content in Discover and Dashboards. This allows you to swap one attribute or hierarchy for another, or add an additional attribute or hierarchy. This will achieve what you require. Currently you cannot limit what appears in the list of attributes, it will show all the attributes from the model:
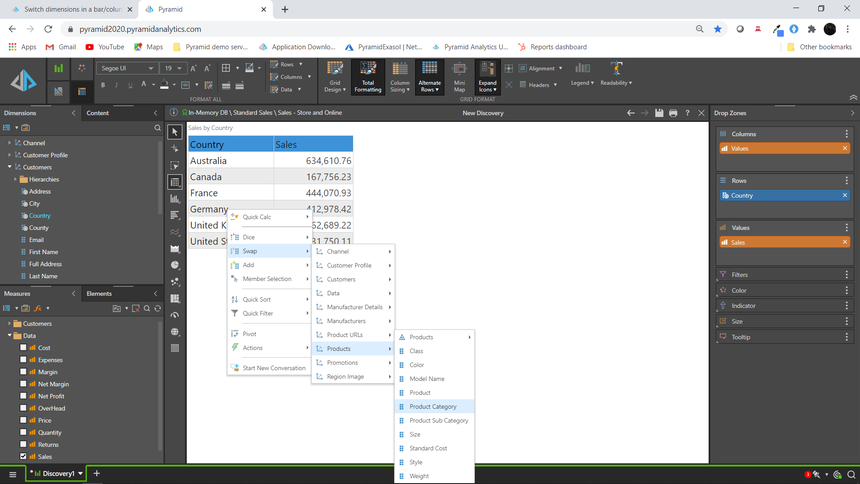
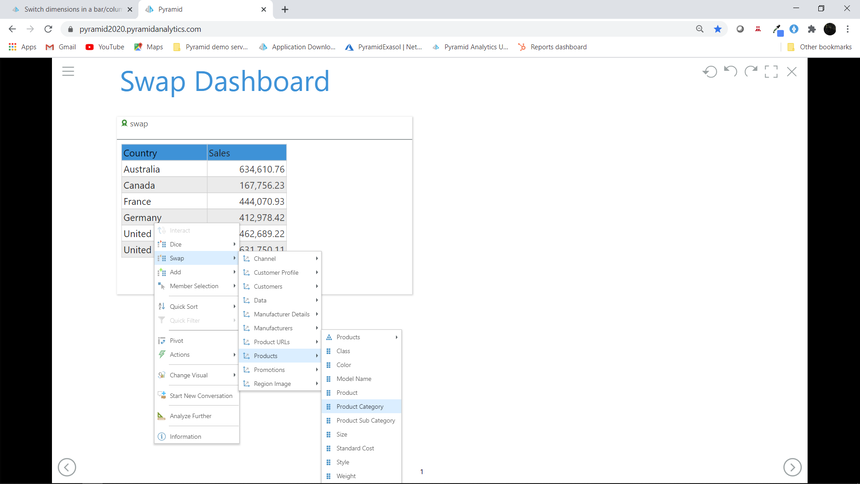
This will work for all analytic content, grids, charts etc., in Discover and in Present.
Hope that helps.
Ian
-
Another option would be to attach an action to the chart in the Dashboard Presentation and jump to another Discover view that used the other attribute.
You can make this another browser tab or a pop up.
This would be useful if you definitely want to limit the attributes used in the swap.
Ian