
0
Add a total line to a graph.
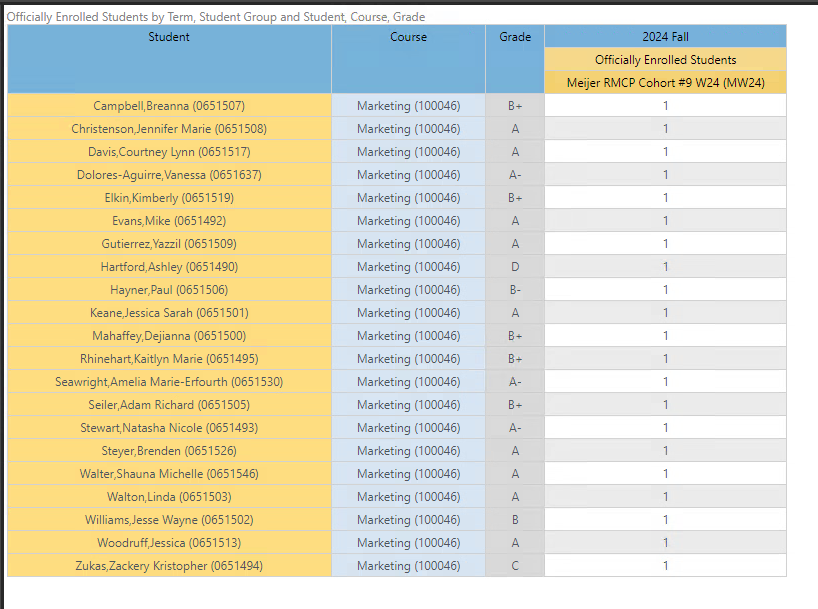
Hi I have a person wanting a chart they can do in Tableau.
In the picture attached the graph shows this information from Pyramid.
The chart shows above the sections a total line. Does anyone know if Pyramid can do the same and show a total line in the same chart?
2 replies
-
Hi ,
Pyramid currently does not let you assign a different chart type to a member of the same series, in this case the total line.
Instead, create a new Measure that is the aggregate of the items concerned, in your case the different course types, in my example, the different product categories. Save the calculation into the Measures dimension.


Then add the Measure, choosing the same axes and the line chart option:

Job done.
Hope that helps.
Ian