
Dashboard Gallery: DataOrbis - Retail Analytics


Dashboard Gallery:
Retail Analytics by
Data Orbis
This real live Dashboard has been developed by our local South African Partner Data Orbis and is used globally in Retailers to analyze the Performance of Products by Category and Outlet.
The Dashboard consists of five Panels
High Level Performance Overview by Category and Retailer

The Main page gives the user access to Performance Data across Subcategories and different Retailers adding colored indicators and numbers to quickly draw the attention to detail. The bottom showcases top and bottom brands across growth and market share. The right side offers Market trends and Top Brand performance numbers.
For further analysis the user can adjust the filter, add or slice the data on the top to narrow the angle and get more detailed information. With a bookmark this view then can be secured.
Notice the text in Green and Red below the filter, giving the users tips on how to work with the data and reduce the number of questions and errors. You will see these tips on all panels.
Precalculated Time Groupings to support comparisons in the Market

The next page dives deeper into time aspect of the data and offers pre-selected filters to show the information on different levels of detail. Users can quickly jump between different views and see the performance over time against other business units.
Interactive Charts and Tables to compare on Product Level
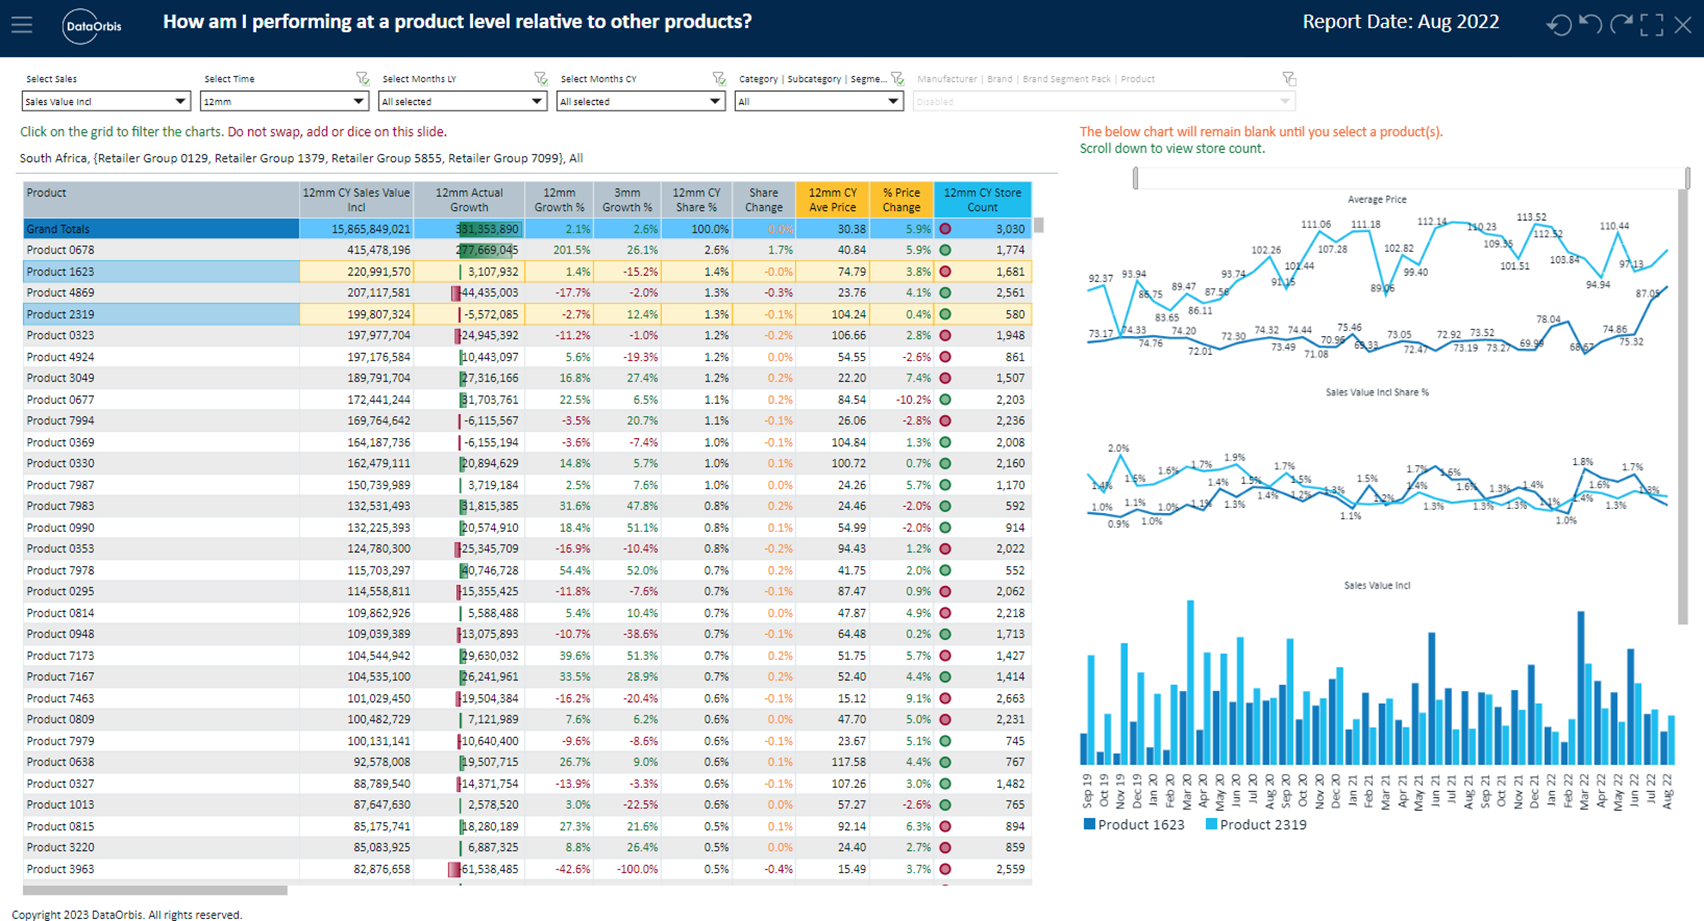
The next page dives even deeper into the products and allows the user to see comparisons on a product level. Comparisons with other products and interactable charts and tables that can be filtered allow the user to get a view on the product that was not available previously. A product manager is now ready to further analyze the reasons for variety in product sales.
Impact analysis for Stock levels and Supply Chain issues

You can only sell what is available or soon to be delivered. Analyzing the Supply Chain and current Stock levels allows the User to find pain points that impede the sales process or detect over stock or imbalances in the distribution of good. This way the situation can be analyzed, mark downs, redistribution or changes in the Orders arranged and the overall profitability be improved. Expander and Tabs on the top level allow to switch through a variety of additional views.
Filter from Category to Store or SKU Level for in depth analysis

Data Orbis uses Filters that are embedded in the right hand panel. Clearing important space on the Dashboard for vital information. This prevents the Dashboard to be to densely populated. New features like Bookmarks further ease the use of this Dashboard.
For further inquiries on this Dashboard, please reach out to
Tammy Le Riche or nicola. lapage from our Partner Data Orbis.