
Dashboard Gallery: Equipment & Energy Management

Dashboard Gallery:
Equipment and Energy Management
This one page summary Dashboard allows the user to get a fast overview about the cost of a set of Tools and Machines and find areas to optimize cost and wear. With rising energy cost this is a good and visual entry point to cost optimization.
High Level Overview for Equipment and Energy Management

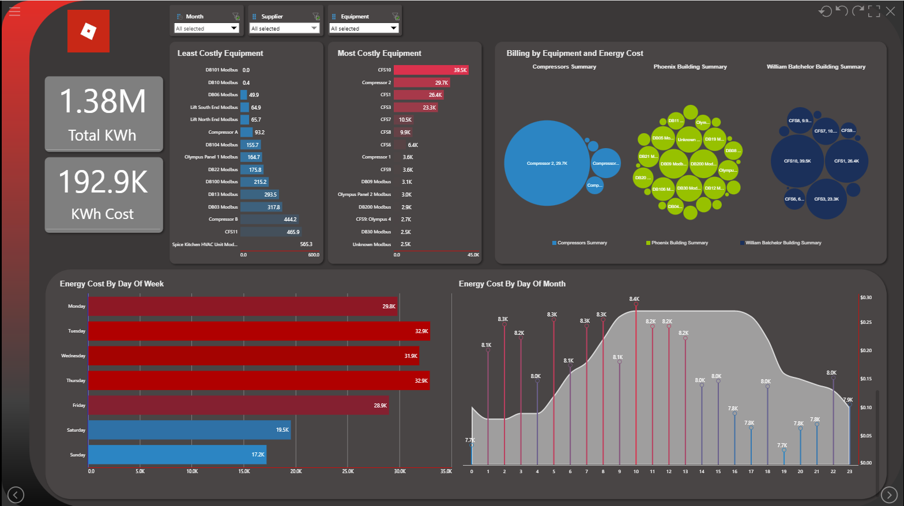
The information on the dashboard show us the energy used and its cost for a company. It displays a top 10 and bottom 10 of most and least costly pieced of equipment used. On the top right we see the products grouped per location and below the Energy cost grouped per day of the week and across the month, the lollypop sticks who the total and the gray area the cost per KWh.
The user now can filter down the report by month, supplier and type of equipment. This way any outliers can be identified and premium supplier identified.
For further inquiries on this Dashboard, please reach out and comment below the article.