0

Hierarchy Not Totalling Correctly When Adding Logic to a Measure Formula

I have a report example that shows values accumulating over a two-year time frame. If, at any point, the value for a specific Part/Type falls below a defined threshold, it is replaced with a static value specific to that part.

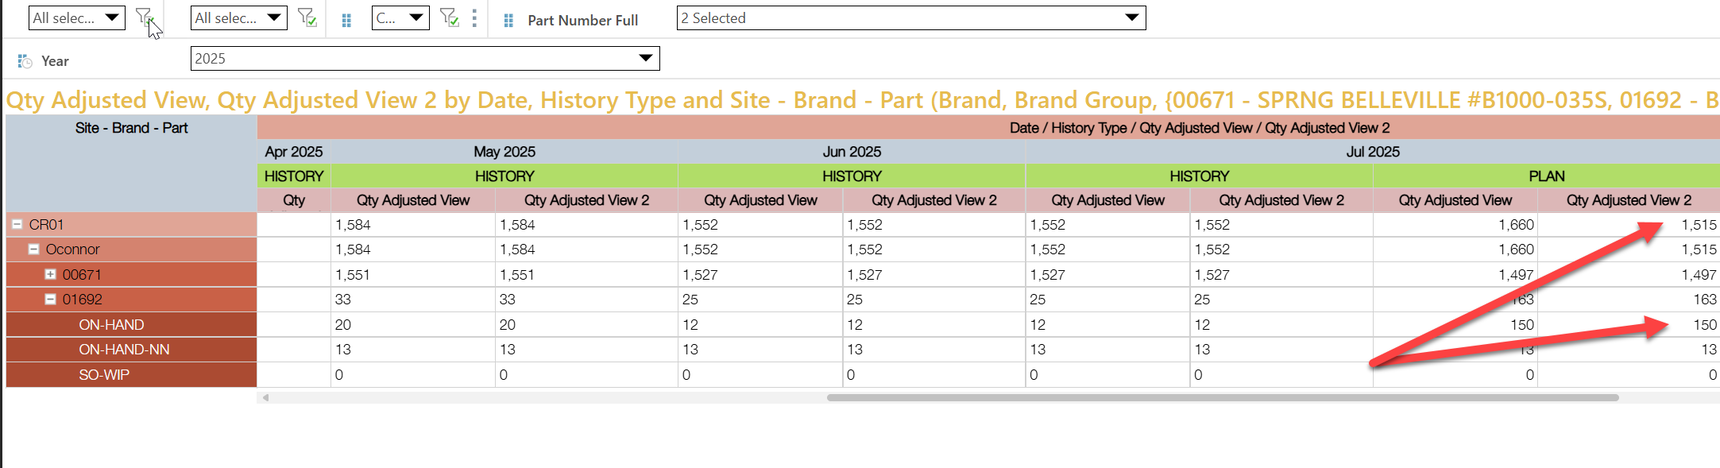
In the example below:

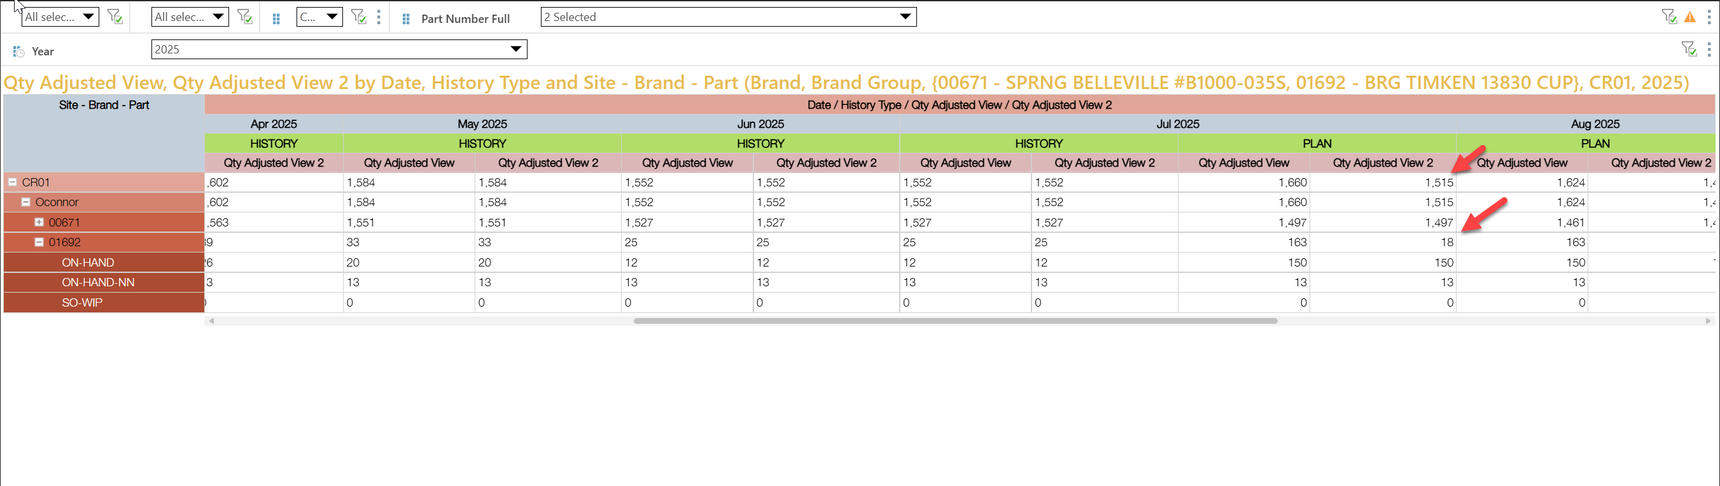
For the period from June to September, for Part 01692 with Type ON-HAND, the values in the Plan column have been overridden and set to 150, replacing the original monthly values:

  • June: 10

  • July: 4

  • August: -7

  • September: -13

This logic is applied using a formula within the measure:
IF current value < threshold THEN new value ELSE current value

The issue I'm encountering is that the hierarchy does not calculate this correctly at the parent levels. For example, at the Part level, it displays a total of 23, whereas it should be 150 + 13 = 163. I believe this happens because Pyramid is aggregating the values across types before comparing to the threshold, rather than applying the logic at the lowest level and then summing the results.

What’s frustrating is that when I add a separate TOTAL column and use SUM instead of AGGREGATE, the result 1684 is correct. However, the top level in the hierarchy still shows 1544.

Can this be fixed?

  • Is there a way to force the hierarchy to use SUM instead of AGGREGATE?

  • Or can the measure be adjusted to apply the threshold logic at the lowest level and then sum the results up through the hierarchy?

8 replies

null
    • imbarmarinescubar_pyram
    • 12 days ago
    • Reported - view

    Hi  ,

    The rolling up of the hierarchy values is the first mathematical operation that happens. The calculation evaluation happens second. This means that expression that you wrote is calculated on top of the base value of the item, after the children have been aggregated. So if you write Measure > X it means that CR01's Measure value is compared, not the sum of the children of CR01 for the given calculation.

    You can create a customized rollup logic to change the natural order of operations:
    1 - create the calculation as you wanted (where measure values > X, do A else B)
    2 - create another calculation which says:
    if the current item in a leaf (has no children) then use the value of the first calculation,
    otherwise sum the leaf children under the current item using the value of the first calculation

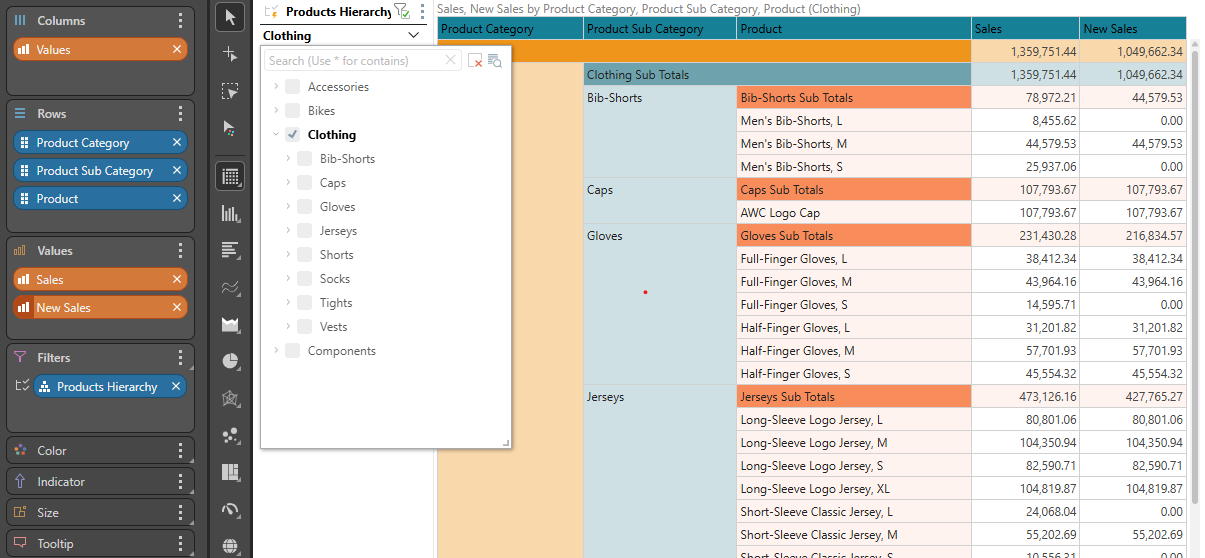
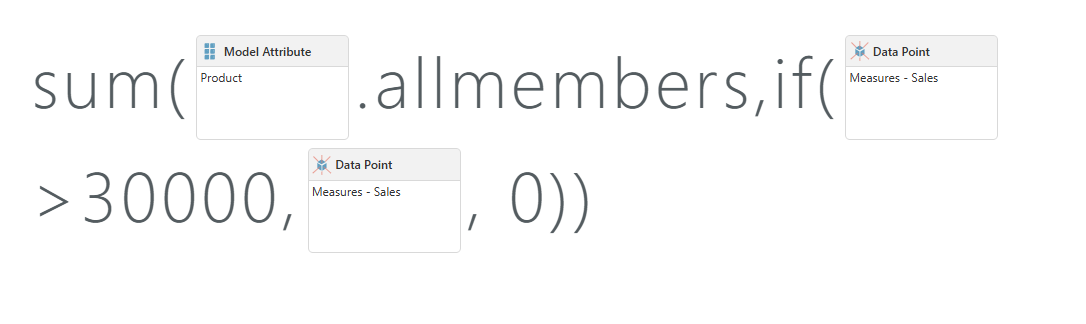
    It would look something like this (focus on the clothing being filtered above 30K)

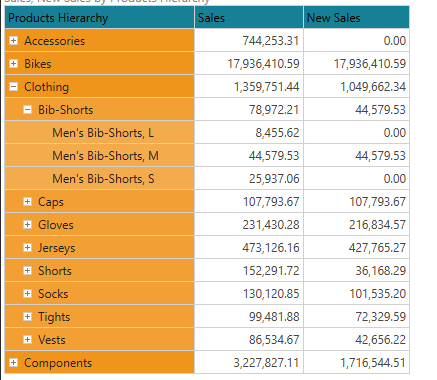
    Sales is the base measure.
    New Sales returns 0 if the current sales value is below 30K

    New Sales Rollup has the new hierarchy aggregation logic

      • Luke_Dyer
      • 11 days ago
      • Reported - view

       Many thanks for replying and explaining this has worked!

      • imbarmarinescubar_pyram
      • 9 days ago
      • Reported - view

      Glad to help  .

      By the way, ObeeOne's second suggestion, if applicable, is even simpler to implement and will perform better.
      You can create a new custom measure that looks something like this:

      Sum(if([table].[value column] < X, new_value, [table].[value column]))

      Note that the column used is the per-aggregated column, not the measure.
      So it would be [facts].[sales] and not [measures].[facts sales].

      This will work if the threshold is testable and the row-level of the data OR if the grid at the hierarchy's leaves is granular enough.

      • Luke_Dyer
      • 8 days ago
      • Reported - view

       Unfortunately its not and I did try this method initially but it did not work. 

      • Luke_Dyer
      • 4 hrs ago
      • Reported - view

       Would you be able to elaborate more on this method, your initial method worked ok on a hand full of parts however for the whole data set it was crashing pyramid. The measure in question is calculated from aggregation of another measure which then aggregated over time using the cumulative time measure another calculated formula measure is added onto this. There is a lot of logic around this field before its placed in the grid. Is the complexity of the measure stopping this other method from working? We cannot just use a pre aggregated fact straight from the data source as more logic is needed using the data from the model.

      • imbarmarinescubar_pyram
      • 2 hrs ago
      • Reported - view

       many deeply nested exotic calculations could require lots of resources and time to evaluate.
      Another approach which is lighter to evaluate is to avoid the hierarchy, and use the attributes directly. 
      So you can create the "new sales" measure, the same way, and then put the 3 attributes of the levels on the rows.
      Now turn on totals as "sum" + subtotals, and you'll see the values of new sales adding up
      You can add the hierarchy as a filter, to clean down the grid to the relevant items.
      This does lower the viewing flexibility of the hierarchy on the rows but is much much lighter to execute:

      Could this work for you report?

      • Luke_Dyer
      • 1 hr ago
      • Reported - view

       This would work, as in show the correct values for each level and is quicker, however the client wanted the hierarchy functionality to only show the level the care to view.

    • Redeemed from the Dark Side (Power BI)
    • Obee1
    • 12 days ago
    • Reported - view

    this is standard behavior.

    It works like this in most high-end analytic engines, like Microsoft OLAP and SAP BW.  You can try and write your own roll-up measure. Another idea, if it's at the grain, is to write your logic into a custom column - this would work out of the box without issue. But it must be at the row level (often not convenient or possible).

Content aside

  • Status Answered
  • 1 hr agoLast active
  • 8Replies
  • 74Views
  • 3 Following