
Dashboard Gallery: Plant Operations

Plant Operations Dashboard
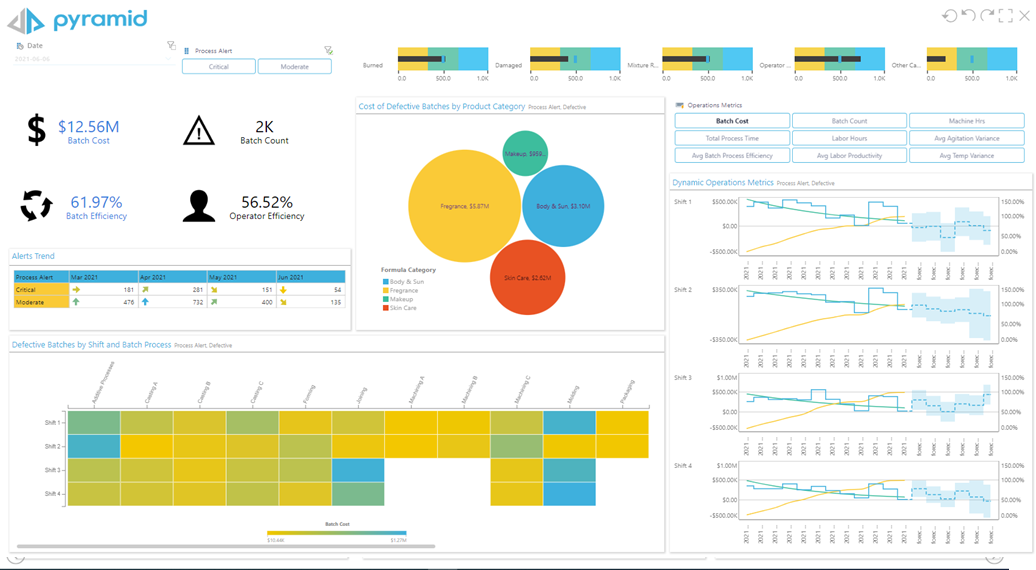
This Dashboard offers a very data rich overview about key indicators on the shop floor. Using the interlinked panels Managers can get a deep insight with just a few clicks. With easy color coding, this could also be used on a big Scree right on the Operations Floor.
1. Filters
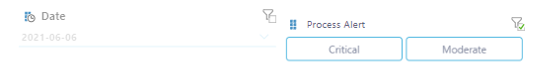
Two simple filters added on the top left, give easy access. Date or Date Ranges select the range viewed. The added toggle between Critical and Moderate Process alerts help to focus on the major issues or keep an overview.
2. Bullet Charts

Bullet Charts are a way to combine achieved + targeted values in a range of expected results. Are we yellow, green or blue and where should we be. As a horizontal Trellis, this give a quick view on the main KPIs.
3. Quick KPIs

A Matrix Grid combines a limited number of KPIs in one central place. Color coding the numbers or changing the graphics according to the values helps to have a clear picture. Grids can be added in Illustrate and Publish
4. Grid Chart with Indicators

A simple grid, enhanced with small arrow showing the trend in that number compared to another period or trend value. These trends can be added with a few clicks in the Discovery
5. Bubble Chart

Bubble Charts like this one are suitable for simple overviews with a selected number of values. It gives a quick glance at rough values by size. Making it clickable helps to drill into the next level of detail.
6. Grid Map

This Grid Map combines Shifts, Production Stage and color codes the number of defective parts. This give a clear indication where and when to look for improvements.
7. Toggled Filters/Selectors

Toggled Filter are perfect when you need an easy way to add or delete values in the corresponding panels. Allowing to 'zoom' into certain values and details. Interactor on the Dashboard allow all panels to react to the same toggles.
8. Trellied detailled Analytics and Forecast
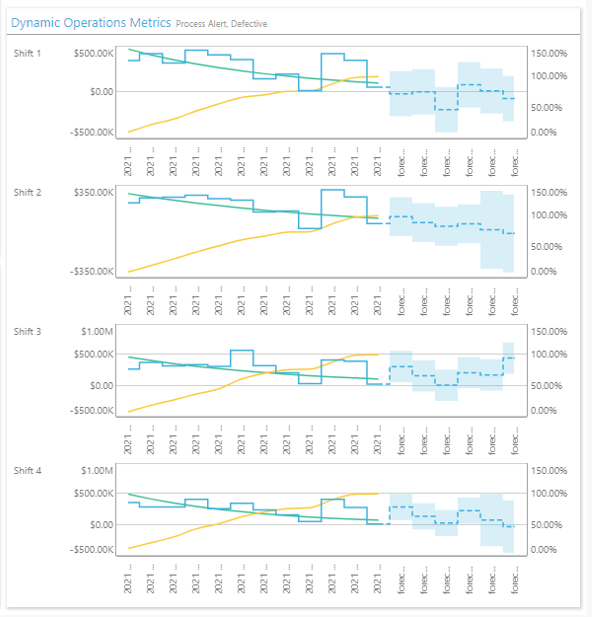
Finished off is this Dashboard with a trellied Line Chart per Shift including a forecast for the next months.
Learn More
Learn more about Reporting and Dashboarding in our Learning Live Sessions about Present
Dive deep into this topic with Training in the Learning Hub: https://learn.pyramidanalytics.com/