
differences in standard deviation
Hi,
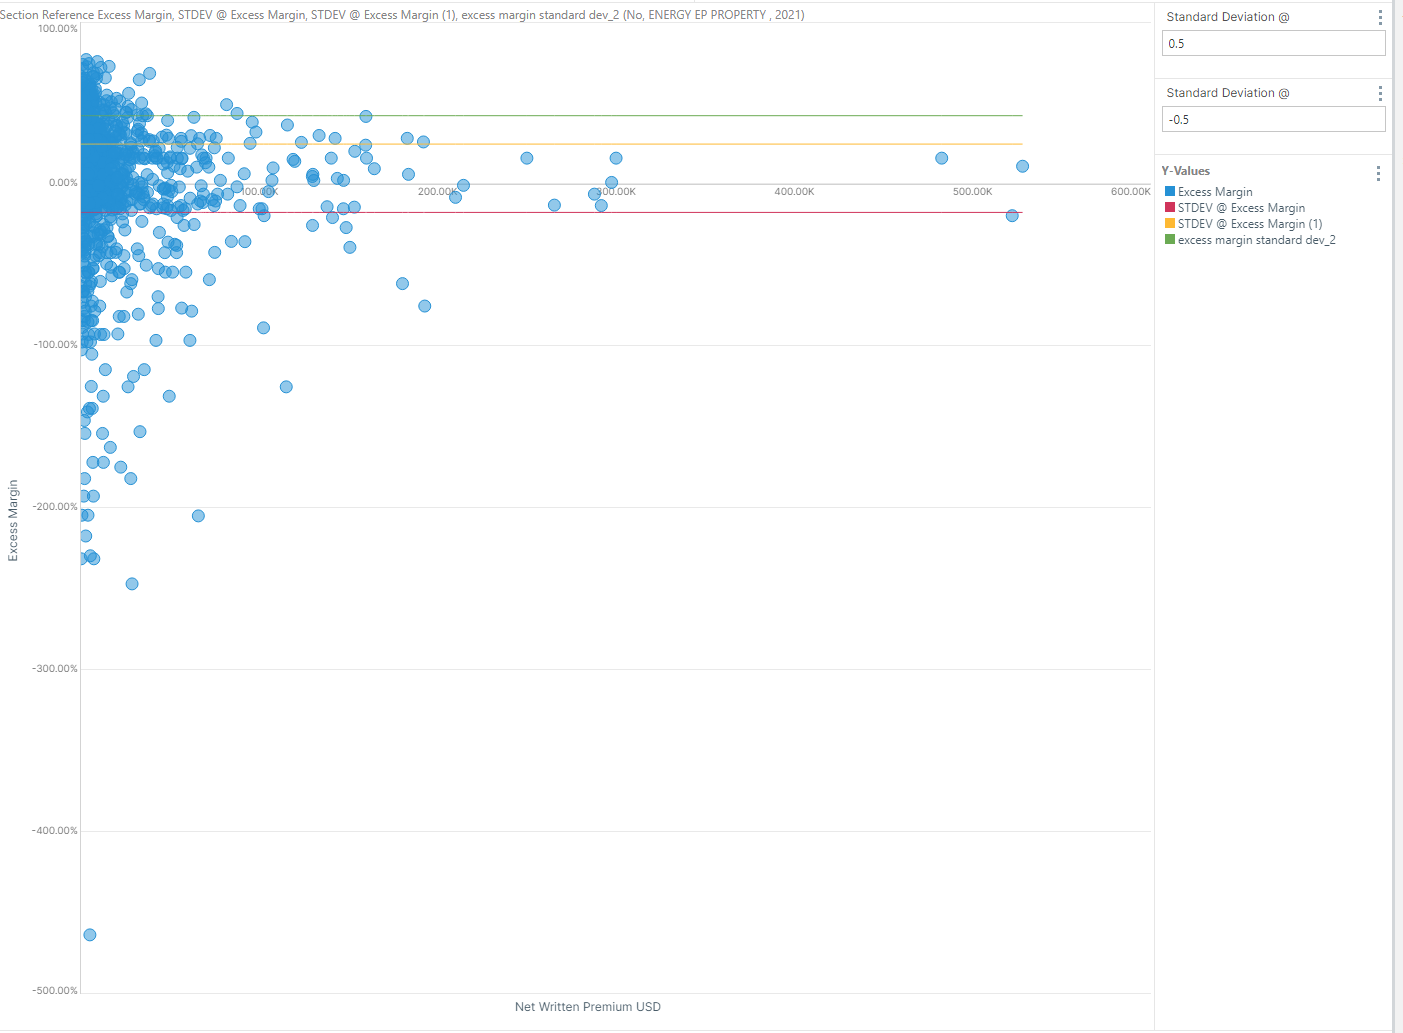
I am working on a scatter plot and want to show the standard deviation. I have used three different methods, one from formulate which gives one standard deviation line (green line), one from the query ribbon > statistics and the last one from right clicking on the measure and creating a 'statistical function' (red and yellow line). As you can see from the graph, using the formulate way produces a different result to the query ribbon method or by right clicking on the measure.
I want to create it via a formulate as I would like it to drive grids later down the line that show the plots above and below the red and yellow lines. Do you know why the formulate way is producing a different line vs the other methods?
Thank you
5 replies
-
Hi Dan Sharman ,
The ribbon and the right-click "statistical functions" both generate the same type of calculation.It is a cartesian, or visual, calculation that produces the value based on the numbers currently on screen and depending on the visual type and structure.
In the scatter plot, the all the values of "Excess margin" within the same trellis part (it seems you only have 1) are used for the formula, which is:
average_of_values + (standard_deviation_of_values * factor)
where factor is the number chosen from the menu.
The the ribbon option creates 2 calculations at the same time, one with factor and a second with negative-factor (so 1.5 and -1.5 for example).
These version of calculations (cartesian calculations) are currently not exposed via the formulation editor and cannot be shared between reports.
Now, regarding the formulate standard deviation, could you please attach an image or type in the PQL syntax that you are using for it, so I could see want exactly is being calculated?
Thanks,
Imbar -
Would you also mind giving an example of the calculation you have provided above?
average_of_values + (standard_deviation_of_values * factor)
I have just tried this in a formulate and wasnt coming back with anything like what the ribbon calculations come back with. So not really sure how to apply it in my example.
Thanks very much ,
Dan

